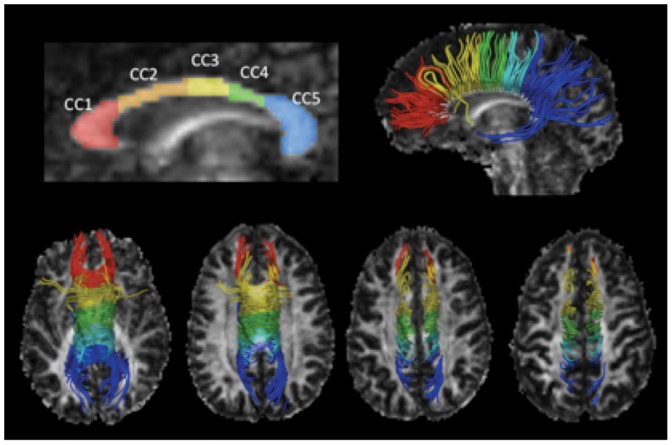
Figure 1.
Corpus callosum segmentation and tractography. The FA map and the CC segmentation model of one healthy subject are illustrated in the top-left of the figure. The top-right image shows the sagittal 3D view of WM tracts derived from the segmented CC projected onto the FA map. The four bottom images show the superior view of the fibers projected in ascending axial slices. CC1: rostrum and genu, connects with the prefrontal and orbitofrontal cortices; CC2: anterior midbody, connects with the premotor and supplementary motor areas; CC3: posterior midbody, connects with the primary motor areas; CC4: isthmus, connects with the primary sensory area; CC5: splenium, connects with the parietal and temporal lobes and the visual cortex.

