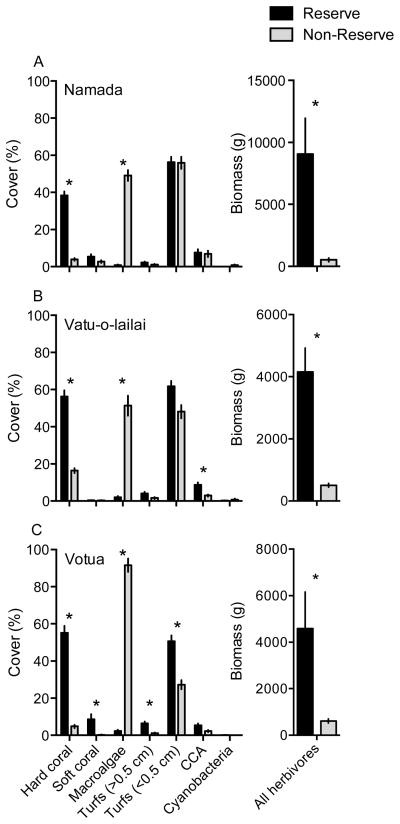
Figure 1.
Abundance (% cover; mean ± SE) of common benthic organisms and biomass (g (150 m2) −1; mean ± SE) of herbivorous fishes inside (black bars) and outside (gray bars) of no-take marine reserves at (A) Namada, (B) Vatu-o-lailai, and (C) Votua villages. * indicates a significant difference between reserve and non-reserve values at a location according to a Bonferonni corrected Mann-Whitney U test. Note scale differences between y-axes. n=20 transects reef−1 location−1 (benthos) or n=12 transects reef−1 location−1 (fish).

