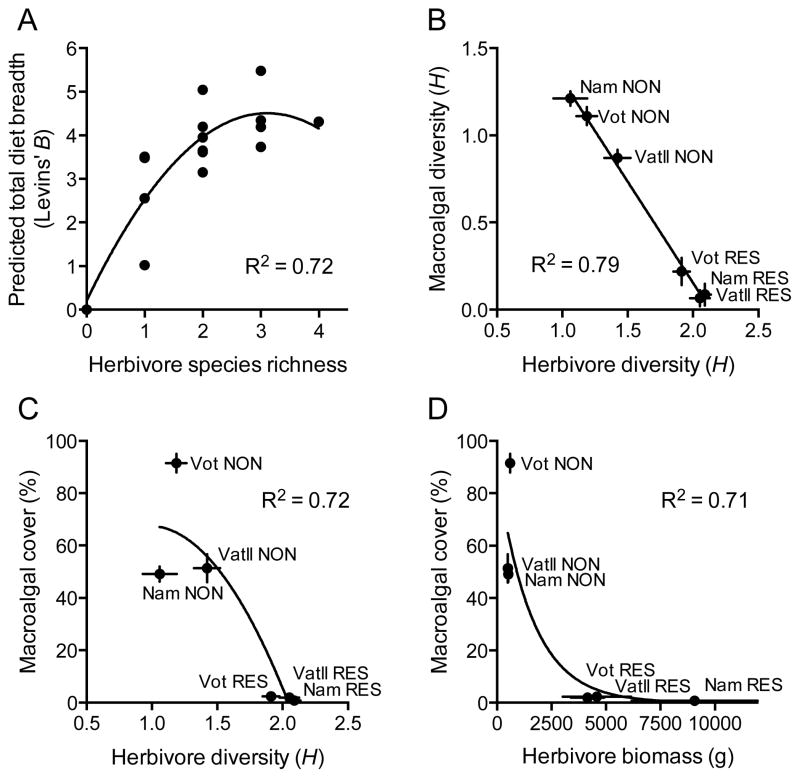
Figure 4.
(A) Predicted total diet breadth (Levins’ B) of the macroalgal browser guild as a function of herbivore species richness, based on empirical bite rate values for each species. (B) Relationship between mean macroalgal diversity and mean herbivorous fish diversity (Shannon’s H; ± SE) at each of the six study sites. (C) Relationship between mean macroalgal abundance (% cover; ± SE) and mean herbivorous fish diversity (Shannon’s H; ± SE) at each of the six study sites. (D) Relationship between mean macroalgal abundance (% cover; ± SE) and mean herbivorous fish biomass (g (150 m2) −1; ± SE) at each of the six study sites. Best-fit linear (A–C) or non-linear (D) regressions were selected following an analysis of fit using AICc criteria and extra sum-of-squares F-tests (Quinn and Keogh 2002). n=20 transects reef−1 location−1 for macroalgal data; n=12 transects reef−1 location−1 for herbivore data.

