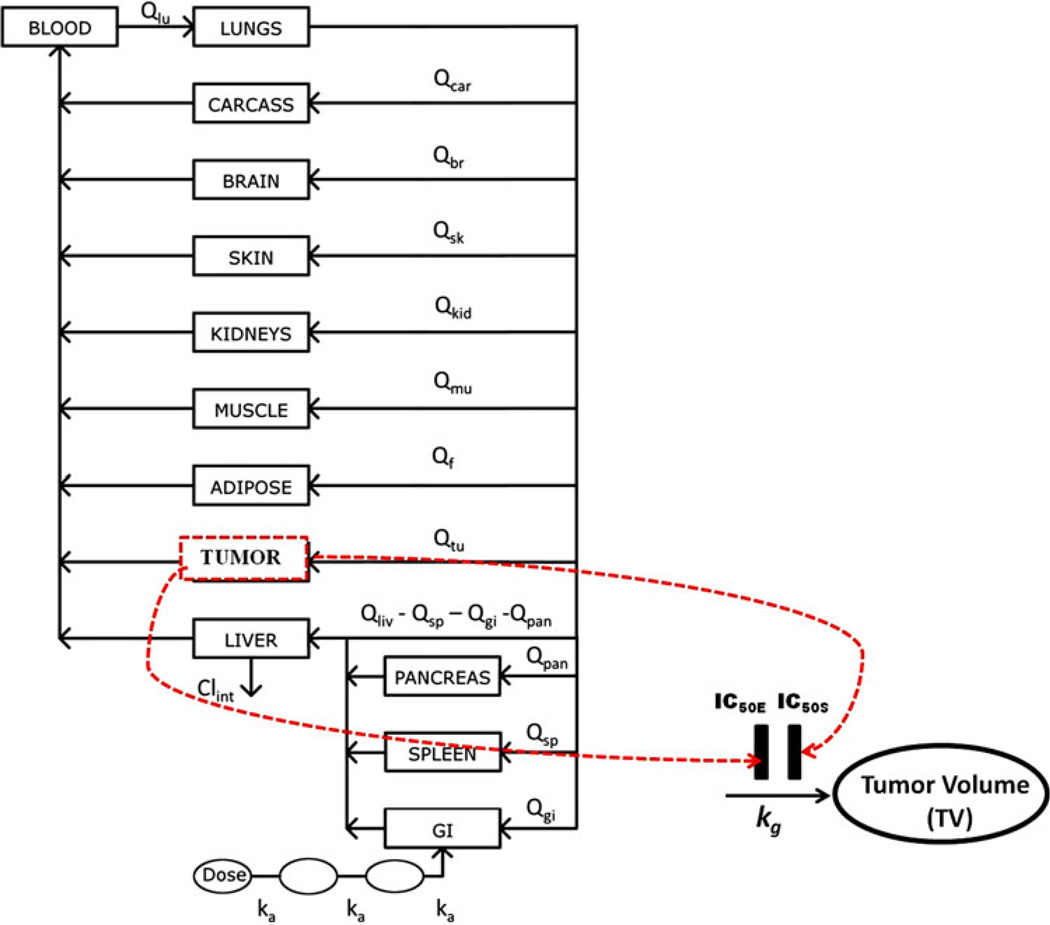
Fig. 1.
PBPK-PD model of drug effects on tumor volume progression. The PBPK model is a representative model for everolimus and sorafenib. The dotted lines represent transduction of drug concentrations into inhibition of tumor growth. Symbols are defined in Table 1

