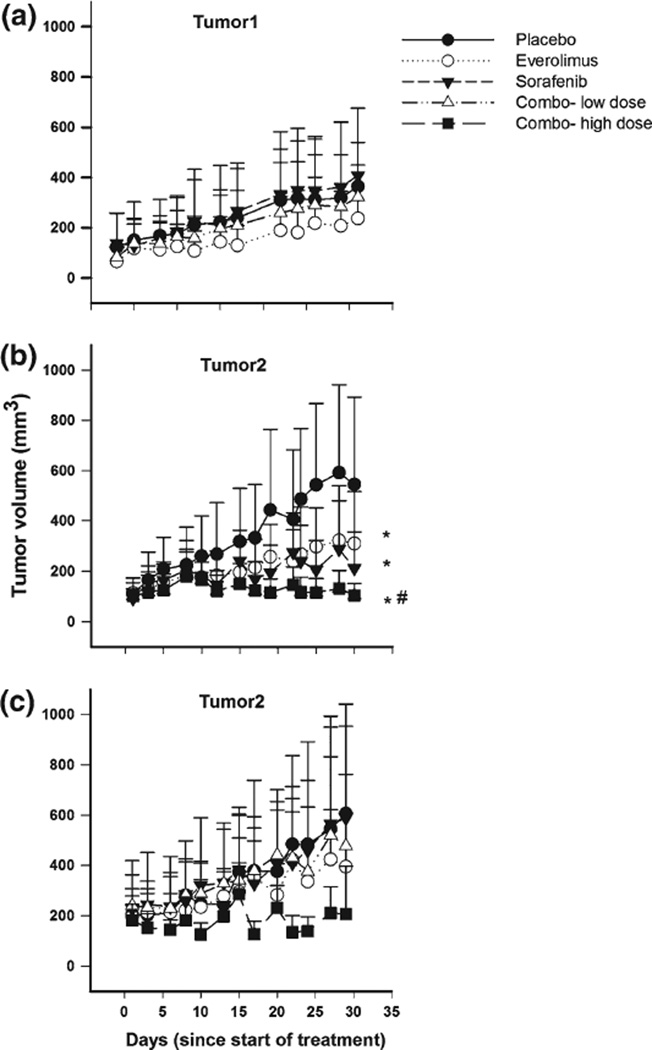
Fig. 2.
Tumor volume as a function of time in control and treated mice. a Tumor1 after dosing with everolimus (0.5 mg/kg), sorafenib (10 mg/ kg), and the combination (everolimus 0.5 mg/kg and sorafenib 10 mg/ kg). b Tumor2 after dosing with everolimus (1 mg/kg), sorafenib (20 mg/kg), and combination (everolimus 1 mg/kg and sorafenib 20 mg/kg) (Tumor volume measured up to day 30). c Tumor2 after dosing with everolimus (0.5 mg/kg), sorafenib (10 mg/kg), combo-low (everolimus 0.5 mg/kg and sorafenib 10 mg/kg), and combo-high (everolimus 1 mg/kg and sorafenib 20 mg/kg) (Tumor volume measured up to day 28). *p <0.05, compared to the control; #p <0.05, compared to individual treatments (p = 0.03—Placebo vs. everolimus treatment, p value = 0.05—Placebo vs. sorafenib treatment, p value = 0.05—Placebo vs. combination treatment)

