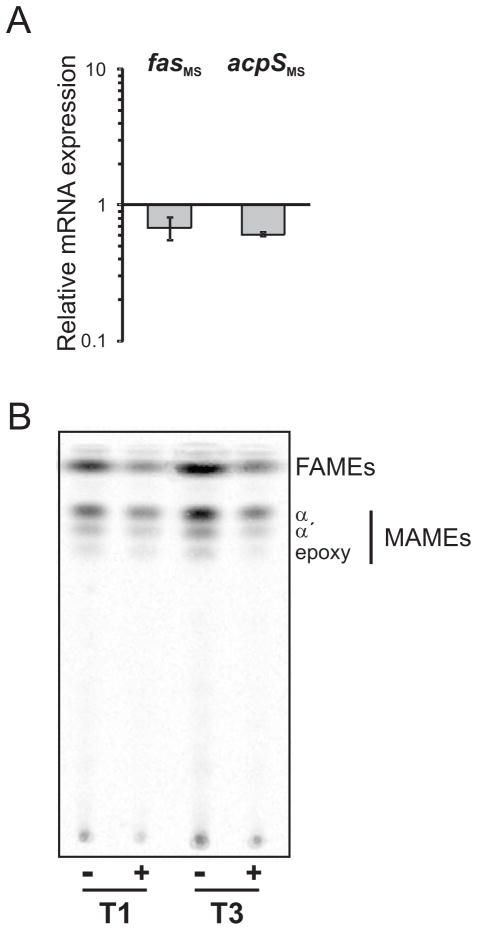
Figure 10.
A. The relative expression level of fas and acpS mRNA was measured by quantitative RT-PCR. Values represent the mean difference between MSPtr:fasRMS strain grown with and without ATc 200 ng ml−1 and are normalized using sigA as an invariant transcript. Samples for RNA extraction were collected 9 h after addition of ATc (T3).
B. Lipid composition of fasR conditional mutant MSPtr:fasRMS. Thin-layer chromatography (TLC) of 14C-labelled methyl esters of mycolic acids (MAMEs) and FA (FAMEs) extracted from MSPtr:fasRMS strain grown with (+) and without (-) ATc 200 ng ml−1. Aliquots were labeled with [14C]-acetate at T1 and T3 for 1 h at 42°C. The sample volumes loaded were normalized according to the optical densities of the cultures. Solvent system: hexane:ethyl acetate (9:1 v/v).

