Figure 9.
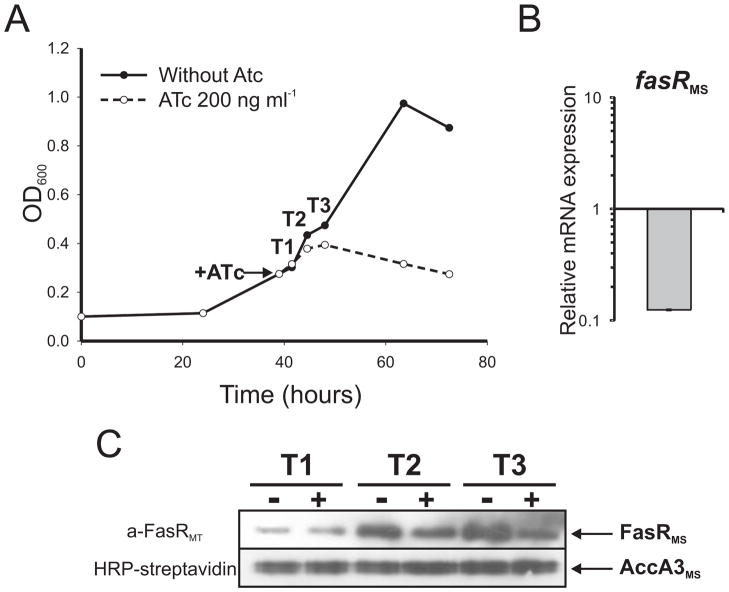
A. Growth curve of strain MSPtr:fasRMS in 7H9 medium. After 40 h, the culture was divided in two equal fractions and one of them was supplemented with ATc 200 ng ml−1 (indicated with an arrow). Samples were taken at different time points (T1, T2 and T3) for further analysis.
B. Changes in the relative amounts of fasR mRNA measured by quantitative RT-PCR. Values represent the mean difference between MSPtr:fasRMS strain grown with and without ATc 200 ng ml−1 and are normalized using sigA as an invariant transcript. Samples for RNA extraction were collected 9 h after addition of ATc (T3).
C. Western blot analysis of total crude lysates from MSPtr:fasRMS strain grown with (+) and without (−) ATc 200 ng ml−1. Detection was performed using anti-FasRMT antibodies elicited in rabbit (upper panel) and horseradish peroxidase conjugated streptavidin to detect the biotinylated protein AccA3 as loading control (lower panel).

