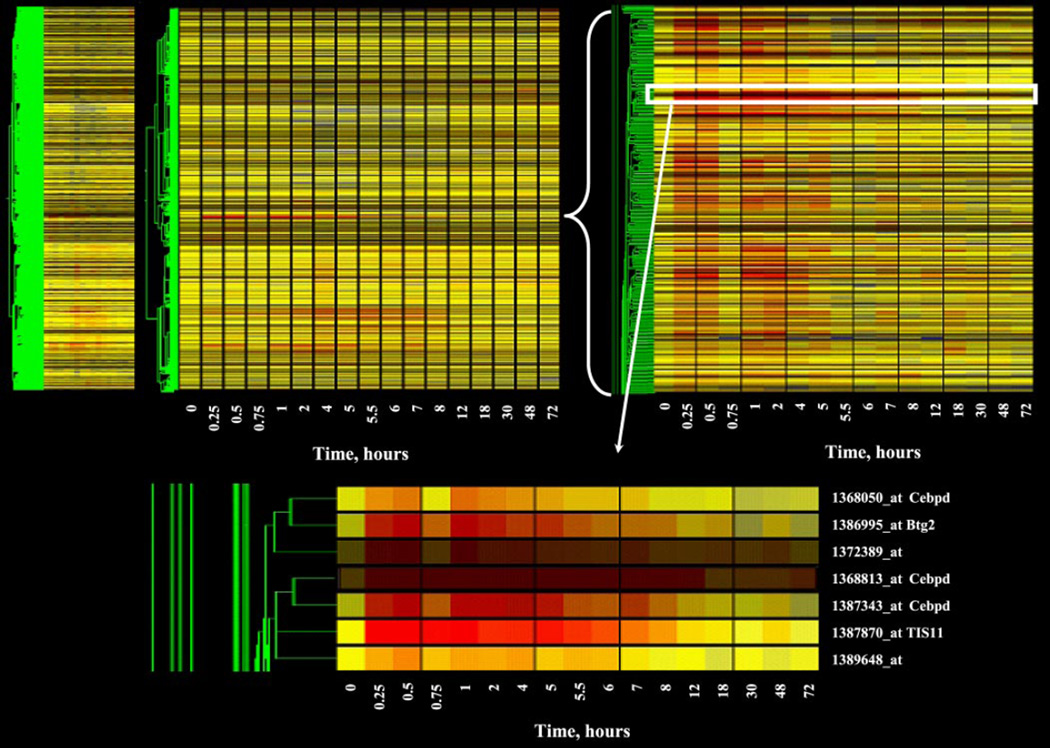
Fig. 1.
Gene tree representation of the entire dataset of mRNA expression in kidney as a function of time after methylprednisolone (MPL) treatment. The gene tree represents the averaged normalized values of each of 15,967 probe sets at 17 different time points after MPL treatment, grouped by pattern similarities. The y-axis represents individual probe sets, with color indicating relative intensities (yellow represents no change from control; progression toward red indicates increased expression; progression toward blue represents decreased expression vs. control values). The x axis ranks samples in sequence of time after MPL treatment. Top left: the entire dataset; top right and bottom: successive zoom-in views of areas highlighted.

