
Figure 1.
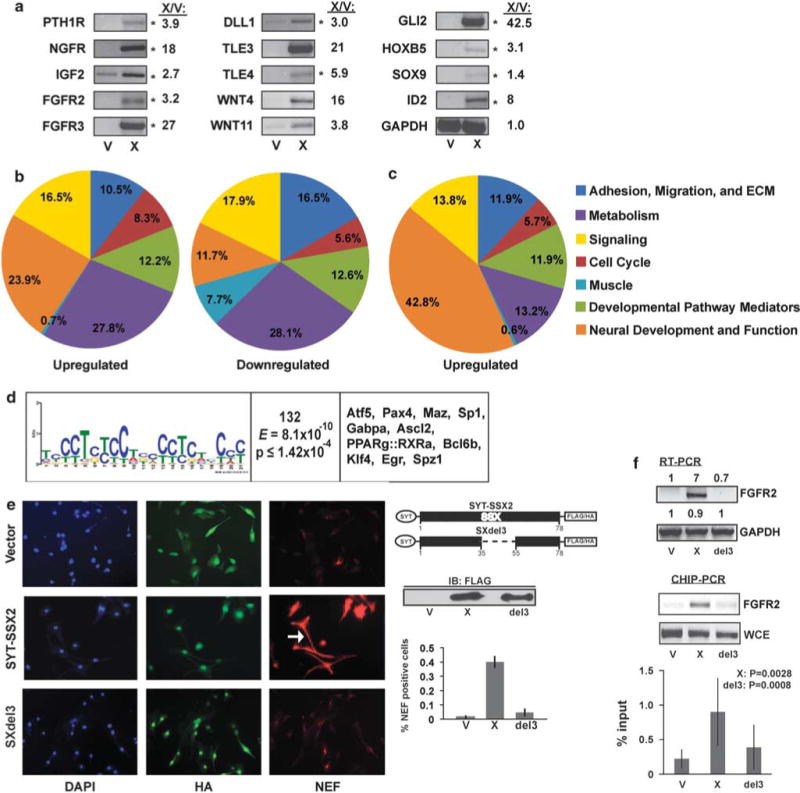
Alterations in cellular programs in myoblasts by SYT-SSX2. (a) RT–PCR in myoblasts expressing SYT–SSX2 (X) or vector control (V). Of 17 genes tested, 14 showed upregulated expression in SYT–SSX2 cells. The asterisks (*) denote genes shared by SYT–SSX2-expressing myoblasts and human SS tumors (Nielsen et al., 2002). GAPDH served as loading control. The X/V ratios represent fold increase in gene transcription, as measured by using the Fluorchem 8900 densitometer, with the AlphaEase FC program. ‘(b) Functional categorization of significantly (1.6-fold change) regulated genes in SYT–SSX2-positive cells. Of the total upregulated and downregulated genes, 695 upregulated (left) and 677 downregulated (right) genes had known functions and are represented in the pie charts. (c) Functional categorization of significantly upregulated genes that also have the SYT–SSX2 complex-binding sites between 0 and 10 kb upstream from their TSS. The functions of 159 genes were annotated and are represented in the pie chart. (d) Motif analysis of SYT–SSX2 ChIPSeq peaks. First column: A putative SYT–SSX2 complex-binding motif derived by MEME. Residue height is proportional to the probability of its presence at a given position. Second column: Number of peaks containing the motif. The E-score and P-value denote the statistical validity of the consensus sequence. Third column: Transcription factors that may bind to the given motif. (e) NEF formation in SYT–SSX2- and SXdel3-expressing myoblasts. Hemagglutinin (HA)-Flag-vector (top row), HA-Flag-SYT-SSX2 (middle row) and HA-Flag-SXdel3 cells were stained for HA (green) and NEF (red), and visualized by fluorescence microscopy. 4′,6-diamidino-2-phenylindole (DAPI, blue) is the nuclear stain. The arrow indicates a cell with a long projection. The images were taken at × 20 magnification. The diagram shows the deleted segment of SSX2 in SXdel3. A Flag immunoblot shows expression levels in V (vector), X (SYT–SSX2) and del3 (SXdel3) cellular lysates. The histogram represents the average ratio of NEF-positive cells to HA-positive cells in V control, X and del3 cells (n = 3). The error bars denote the standard deviation. (f) FGFR2 RT–PCR in myoblasts expressing vector control (V), SYT–SSX2 (X) or SXdel3 (del3). The numbers represent the ratios of expression levels in X and del3 over V cells. Signal intensities were measured by using the Fluorchem 8900 densitometer, with the AlphaEase FC program. Lower panel: ChIP of SYT–SSX2 and SXdel3 at the peak located upstream from the Fgfr2 gene, using the anti-Flag antibody, in V control, X and del3 myoblasts. Whole-cell extract DNA (WCE) served as positive control. The histogram represents the average of SYT–SSX2, SXdel3 and control vector binding to the Fgfr2 peak, measured as percent input. Results from four ChIP–PCR experiments were used for the analysis. The error bars are the standard deviations. X:P denotes the significance of X values relative to V. Del3:P denotes the significance of SXdel3 values relative to X.