
Figure 3.
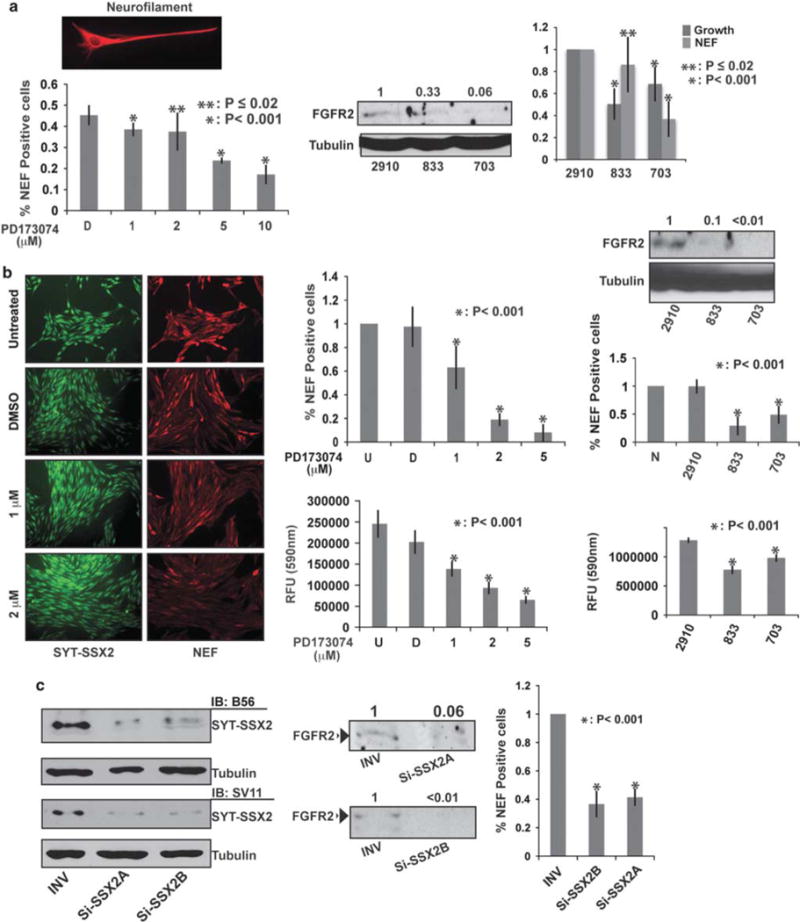
Contribution of FGFR2 to SYT-SSX2’s differentiation effects and to cell growth. (a) Loss of neurite extensions and NEF signal intensity after inhibition of FGF signaling in SYT-SSX2 (HA-positive) BMMSCs. The top left image depicts a reference NEF (red)-positive, SYT-SSX2-expressing BMMSC. The left histogram represents the average ratio of NEF-positive to HA-positive cells 2 days after treatment with PD173074 at the indicated concentrations (n = 4; approximately 1000 cells were included for each concentration). D is vehicle DMSO. The error bars denote the standard deviation. The P-values reflect the significance of the experimental values compared with the vehicle (D). Middle panel: Immunoblot of FGFR2 levels in SYT-SSX2-expressing BMMSCs infected with the indicated FGFR2-shRNAs. 2910 is the non-targeting vector and tubulin is loading control. The numbers indicate the ratio of FGFR2 signal in the cells expressing targeting shRNAs relative to non-targeting vector (value 1). Right histogram: The dark gray bars are the average of 833 and 703 cell number over 2910 (value 1). The 2910, 833 and 703 originated from the same SYT-SSX2-expressing BMMSCs pool (n = 3). The light-gray bars are the average ratio of NEF-positive 833 and 703 cells over 2910 NEF-positive (value 1) cells. The error bars indicate the standard deviation. The P-values indicate the significance of the experimental values with the targeting shRNAs as compared with non-targeting vector (2910). (b) Decreased NEF expression and growth of SS SYO-1 cells after inhibition of FGF signaling. The left image panel depicts the NEF signal (red) with increasing concentrations of PD173074in SYO-1 cells. Nuclear SYT-SSX2 (green) was visualized with the anti-SSX2 B56 antibody. DMSO was the vehicle control. The images were taken at × 20 magnification. Middle upper histogram: The average ratio of NEF-positive cells exposed to DMSO (D) or PD173074 to untreated (U; value 1) SYO-1 cells (n = 2; over 1000 cells were included in each category). The error bars indicate the standard deviation. The P-value reflects the significance of the experimental values as compared with the vehicle (D). The middle lower histogram shows growth inhibition of SYO-1 cells with increasing concentrations of PD173074 (n = 2). Cell growth was estimated by using the SRB colorimetric assay. The error bars represent the standard deviation. The P-value reflects the significance of the experimental values as compared with the vehicle (D). The immunoblot shows the FGFR2 levels in shRNA-treated SYO-1 cells. Tubulin is the loading control. The numbers indicate the ratio of FGFR2 signal in targeting shRNA cells relative to non-targeting vector (2910). Upper right histogram: The effect of 2910, 833 and 703 FGFR2-shRNAs on NEF expression in SYO-1 cells, relative to NEF-positive naïve (N; value 1) cells. The error bars represent the standard deviation (n = 3; approximately 1000 cells were included for each category). The P-value indicates significance of the experimental values with the targeting shRNAs as compared with the non-targeting vector (2910). The lower right histogram demonstrates the effect of the three FGFR2-shRNAs on SYO-1 growth by using the SRB assay (n = 2). The error bars represent the standard deviation. The P-value indicates the significance of the experimental values with the targeting shRNAs as compared with the non-targeting vector (2910). (c) Effect of SYT-SSX2 small interfering RNA in SYO-1 cells. Left immunoblot: SYT-SSX2 levels in INV control and two SSX2-targeting RNAs (Si-SSX2A and Si-SSX2B) in SYO-1 lysates detected with the antibodies B56 (anti-SSX2) and SV11 (anti-SYT). Tubulin is the loading control. Middle immunoblot: FGFR2 levels in the same lysates. The numbers indicate the ratio of FGFR2 signal with the targeting Si-SSX2 SiRNAs over a control RNA (INV). Histogram: The effect of SYT-SSX2 small interfering RNA on NEF formation in SYO-1 cells. The numbers indicate the average ratio of NEF-positive Si-SSX2A and Si-SSX2B cells to NEF-positive INV control cells (value 1). The error bars denote the standard deviation (n = 3; over 1000 cells were counted for each category). The P-value indicates the significance of the experimental values with the targeting Si-SSX2 SiRNAs as compared with the control RNA (INV). Measurements of FGFR2 depletion by the targeting shRNAs, or by the SYT-SSX2 SiRNAs, were performed by using the Fluorchem 8900 densitometer, and analyzed with the AlphaEase FC software.