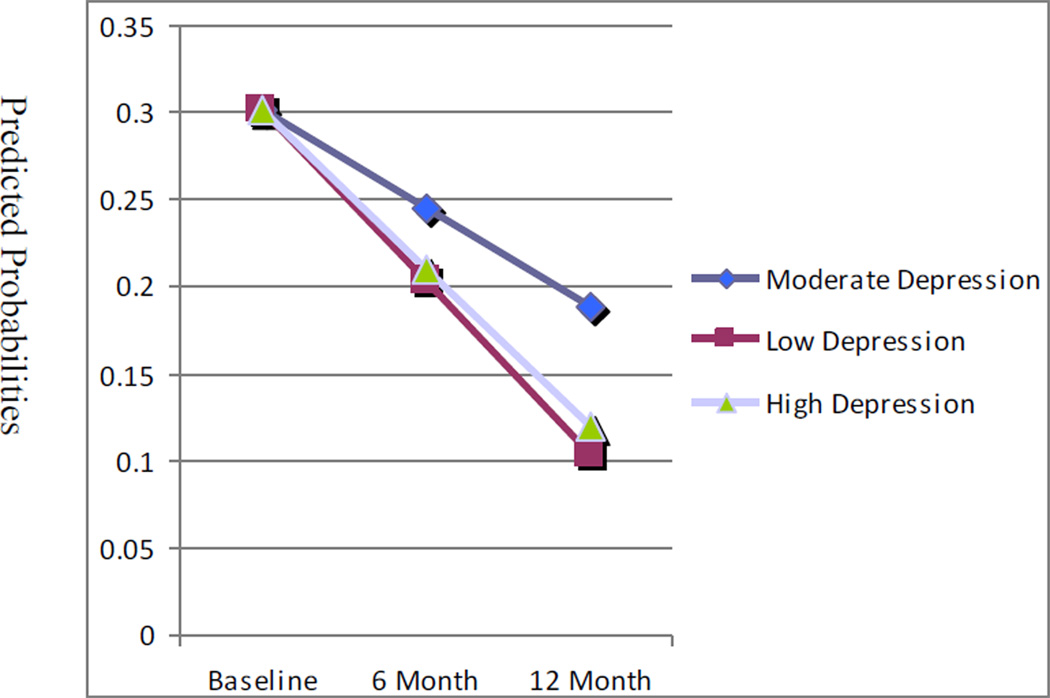
Figure 1.
Change in the Predicted Probabilities of Sexual Risk Over Time for Groups Low, Moderate and High in Depression
NOTE: Depression groups were categorized by quartiles where by the middle two quartiles (moderate depression) are compared to the lowest quartile (low depression) and the highest quartile (high depression). The slopes reported are predicted probabilities controlling for other covariates in the model.

