Figure 2.
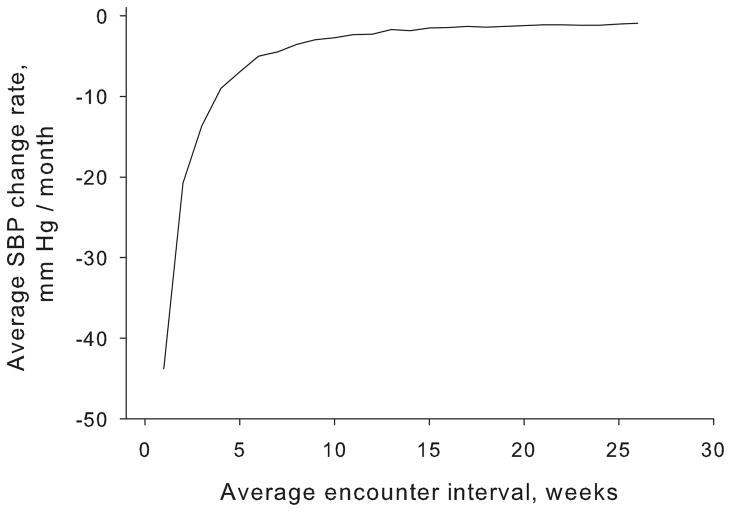
Figure 2A. Encounter Interval and Rate of Change of Systolic Blood Pressure
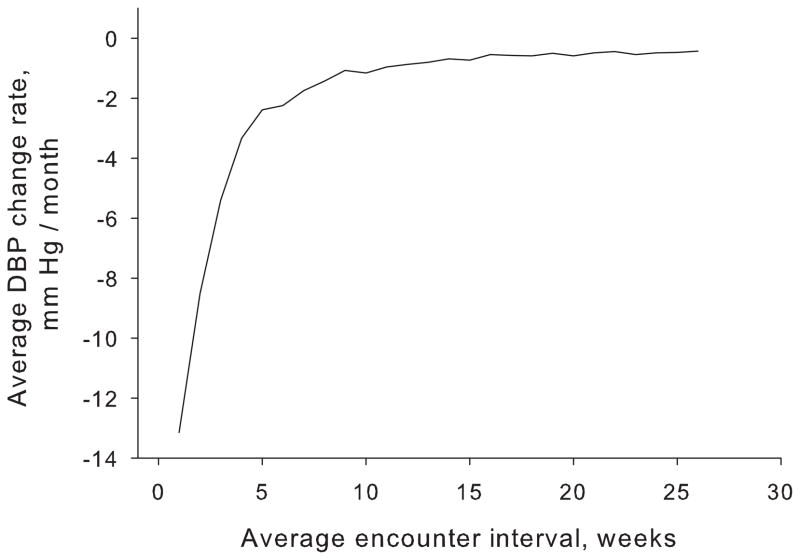
The average monthly change in systolic (A) and diastolic (B) blood pressure, respectively, was plotted against the average encounter interval. Distinct periods of elevated blood pressure (from the first elevated to the first normal blood pressure) for the same patient were analyzed separately. Dotted lines indicate 95% confidence interval.
Figure 2B. Encounter Interval and Rate of Change of Diastolic Blood Pressure


