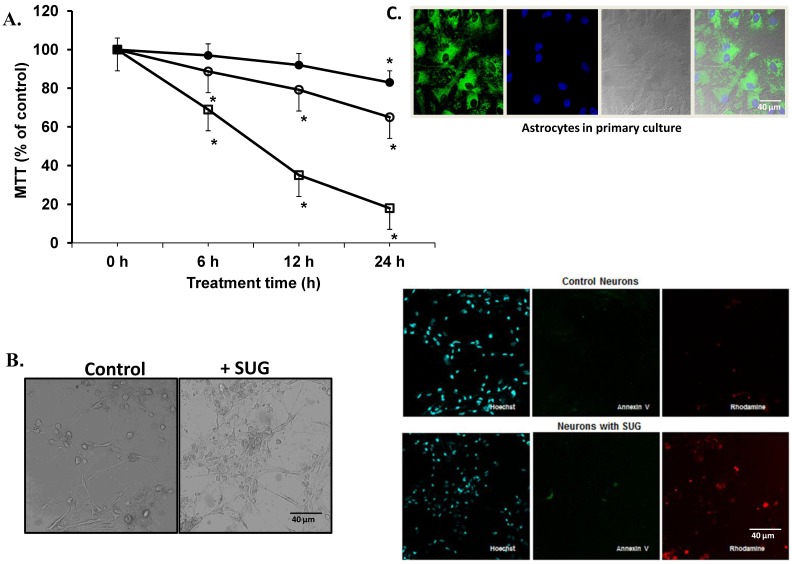
Fig 1.
(A) Neuronal cell death induced by sugammadex. Time- and concentration-dependent neurotoxicity of SUG was determined by the MTT assay (*p < 0.01). ● (37.5 µg SUG/ml), ○ (75 µg SUG/ml), and □ (150 µg SUG/ml). Data are means ± SD for 5 independent experiments. *p < 0.01 comparing SUG vs controls (no additions). ANOVA (two way) was used when needed. (B) Optic microscopic image of cultured neurons incubated in the absence or in the presence of SUG (75 µg/ml, 24 h). The % of viable cells in control cultures was always > 95%. (C) Immunofluorescence of neurons in primary culture with Hoechst, Annexin V and Rhodamine was used. Astrocytes marked with Hoechst and mitotracker also are shown.

