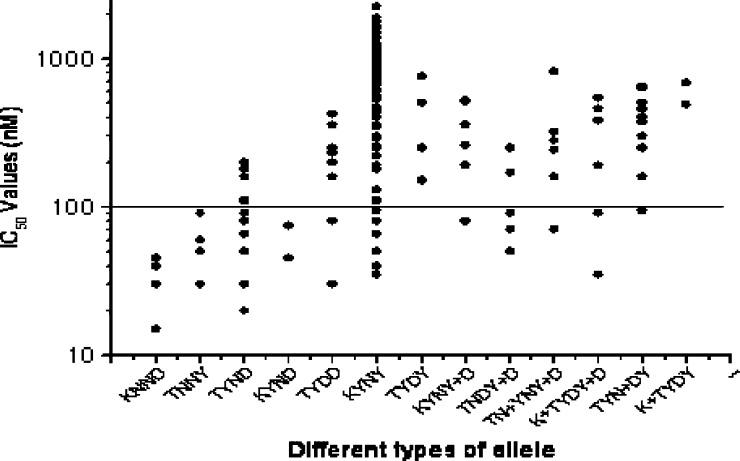
Figure 3.
Relationship between the phenotype determined by in vitro drug sensitivity assays, expressed as IC50 of CQ, and the pfcrt and pfmdr-I genotypes, defined by either the absence of mutations (wild type) or presence of point mutations. Here, different genotype are classified as KNND (K76, N86, N1042, D1246), TNNY (T76, N86, N1042, Y1246), TYND (T76, Y86, N1042, D1246), KYND (K76, Y86, N1042, D1246), TYDD (T76, Y86, D1042, D1246), KYNY (K76, Y86, N1042, Y1246), TYDY (T76, Y86, D1042, Y1246), KYNY+D (K76, Y86, N1042, Y+D1246), TNDY+D (T76, N86, D1042, Y+D1246), TN+YNY+D (T76, N+Y86, N1042, Y+D1246), K+TYDY+D (K+T76, Y86, D1042, Y+D1246), TYN+DY (T76, Y86, N+D1042, Y1246), and K+TYDY (K+T76, Y86, D1042, Y1246). The solid line (corresponding to 100 nM; highly resistant) hypothetically shows the resistance levels for in vitro CQ resistance.

