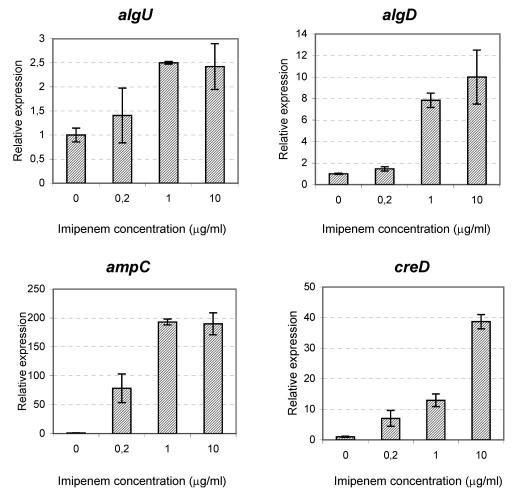
FIG. 3.
Expression of algU, algD, ampC, and creD genes in the presence of increasing concentrations of imipenem measured by real-time PCR. Each experiment was done in duplicate. The data are presented as means, and error bars represent 95% confidence intervals. In all four charts, the expression levels are normalized to the level of expression of the noninduced biofilms.

