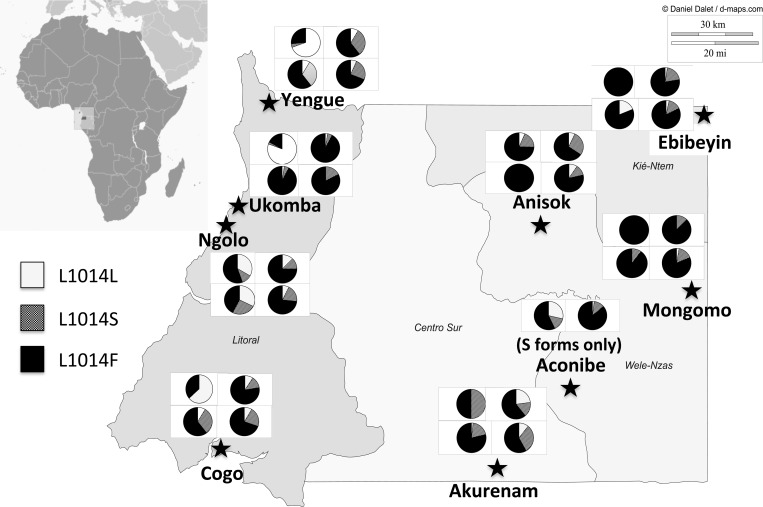
Figure 1.
Continental Equatorial Guinea showing sampling locations. Stars indicate sites for which pre-intervention and post-intervention sampling was conducted. White squares summarize knockdown resistance (kdr) allele frequencies as four pie charts for the M (top) and S (bottom) molecular forms for 2007 (left) and 2009–2011 (right) samples. Circles indicate sampling sites where only post-intervention samples were available.

