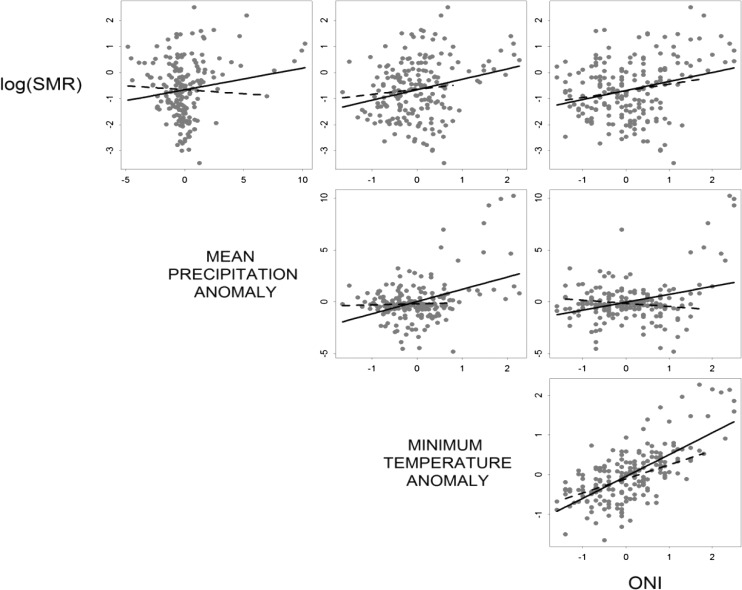
Figure 3.
Scatter matrix showing the relations between log dengue SMR and anomalies in climate variables at the most significant lags: SMR versus precipitation at a 1-month lag, SMR versus minimum temperature at a 2-month lag, and SMR versus ONI at a 3-month lag. Solid line = linear regression curves for 1995–2010; dashed line = linear regression curves for 2001–2010.

