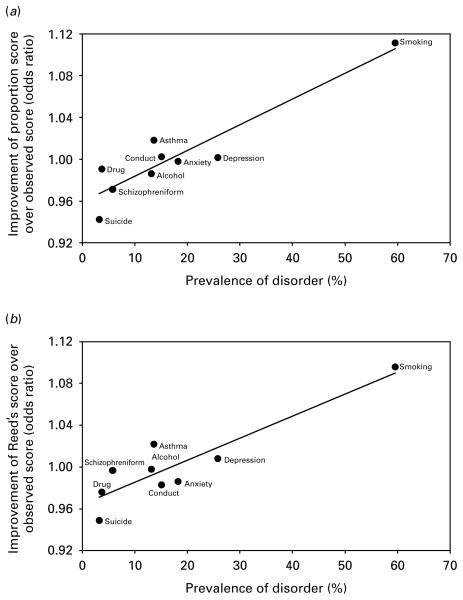
Fig. 2.
Scatter-plots of prevalence of psychiatric disorders, smoking and asthma in family members versus the odds ratio assessing the difference in estimates of family history associations between the proportion score and the observed score (a), and versus the odds ratio assessing the difference in estimates of family history associations between Reed’s score (Reed et al. 1986) and the observed score (b). The solid lines in each plot are fitted regression lines ; Pearson’s correlation coefficients are r=0.93 for (a) and r=0.91 for (b). Correlations were still strong if smoking, which is likely to exert a strong effect on the magnitude of the correlations, was excluded from analyses [r=0.65 for (a) and r=0.58 for (b)].

