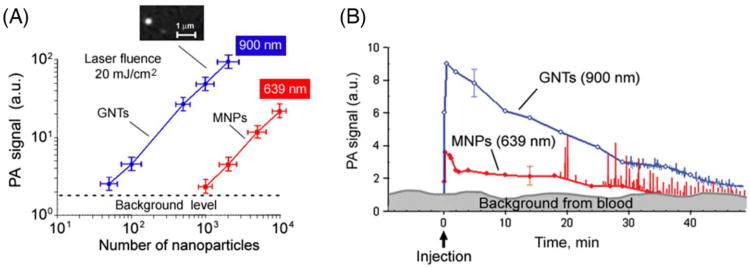
Figure 3.
Optimization of NP parameters in vitro and in vivo. (A) In vitro PA signals from NPs at different concentrations in a slide. Callout represents fluorescent images of individual GNTs conjugated with FITC and Abs specific to CD44. (B) In vivo measurements of NPs and cells mimicking CTCs. Kinetics of clearance of 30-nm MNPs (red curve with filled circles) and GNTs (blue curve with open circles) at a concentration of 1 × 10¹¹ NPs/mL in a 70-μm mouse ear vein. The error bars represent standard error (n = 3). Adapted with permission from ref 13. Copyright 2009 Nature Publishing Group.

