Figure 5.
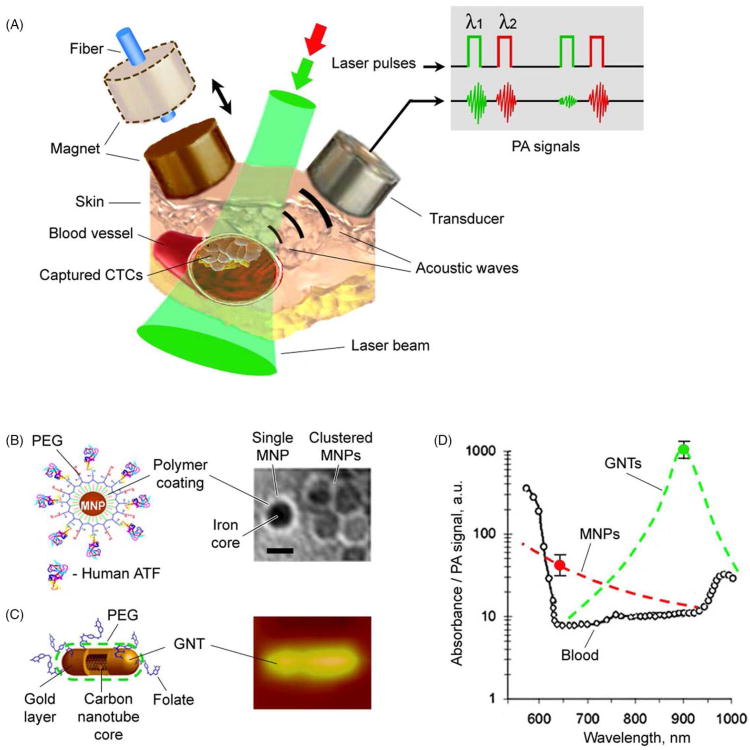
In vivo magnetic enrichment and two-color PA detection of CTCs. (A) Schematic with laser beam outside magnet or fiber-based laser delivery through the hole in magnet (dashed lines). (B) The 10-nm MNPs coated with amphiphilic triblock polymers, polyethylene glycol (PEG) and the amino-terminal fragment (ATF). (C) The 12 × 98-nm GNTs coated with PEG and folate. (D) PA spectra of ∼70-μm veins in mouse ear (open circles). The average standard deviation for each wavelength is 18%. Absorption spectra of the MNPs and GNTs (dashed curves) normalized to PA signals from CTC labeled with MNPs (black circle) and GNTs (open circle). Adapted with permission from ref 13. Copyright 2009 Nature Publishing Group.

