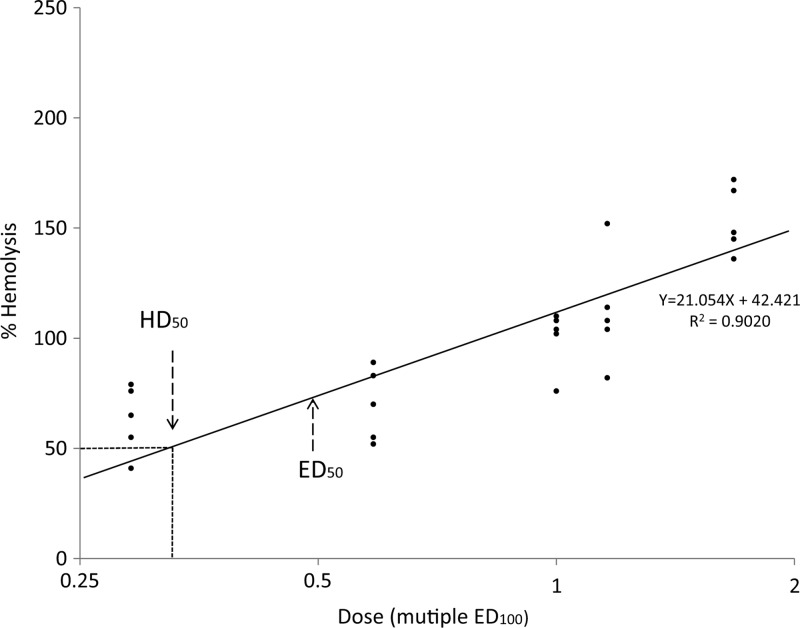
Figure 4.
Therapeutic index calculation. A scatter plot was created with effective dose (ED) doses (Log2) of test drugs on the x axis, and percent of red blood cell (RBC) hemolysis on the y axis. The percentage of RBC loss induced by primaquine given at ED100 was defined as 100% hemolysis. The Therapeutic Index was calculated as HD50 over ED50.

