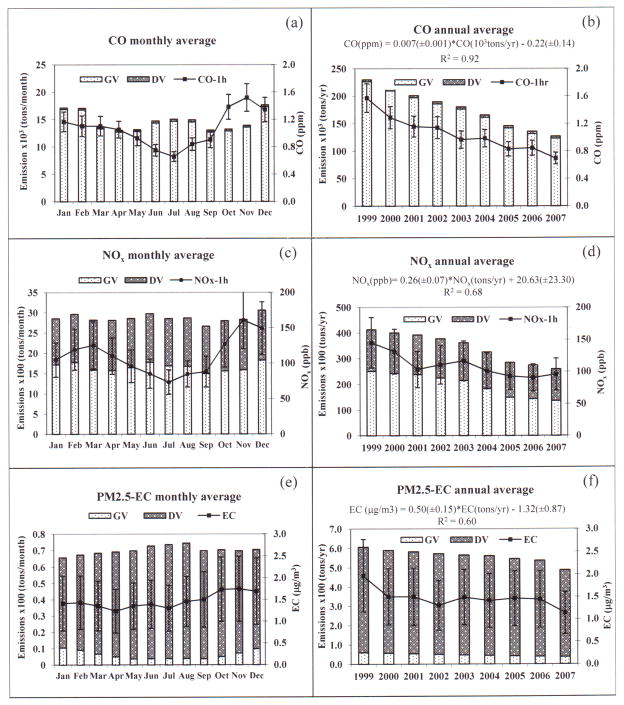
Figure 2.
Monthly and annual trends of CO, NOx and EC. Bars represent emissions estimates from MOVES in tons/month (a, c, e) or tons/yr (b, d, f). Bold line represents ambient air concentrations of CO (ppm), NOx (ppb) and EC (μg/m3) on right vertical scale. Error bars are the root mean square (RMS) error of daily uncertainties from measurements. R2 denotes the correlation between annual emissions and annual average concentrations.

