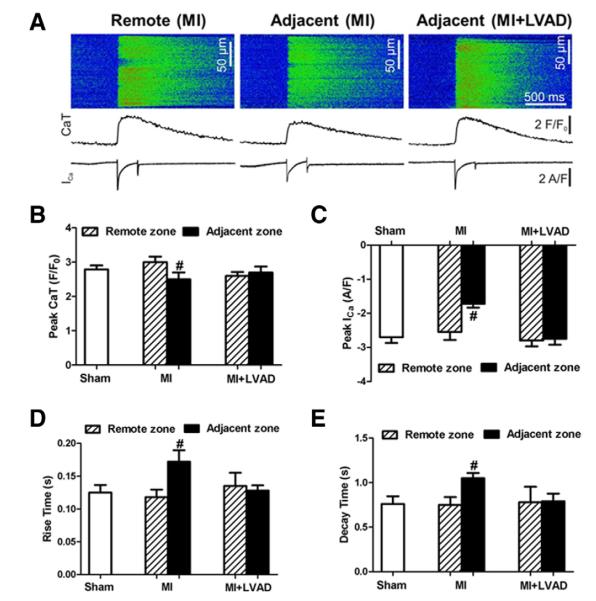
Figure 7. Electrophysiological Ca2+ Cycling in Single Cardiomyocytes.
(A) Fluorescence of the Ca2+ indicator fluo-4 (top panels and middle traces) and whole-cell membrane currents during a voltage increase from −80 to 0 mV after inactivating the Na+ channels (bottom traces). (B) The average peak Ca2+ transient (CaT). (C) The peak inward Ca2+ current (peak Ica). (D) The time the Ca2+ transients took to reach the peak (rise time). (E) The time required for the transients to decay from 90% of the peak to 10% (decay time). #p < 0.05 compared with the remote zone of same animal. Abbreviations as in Figure 3.

