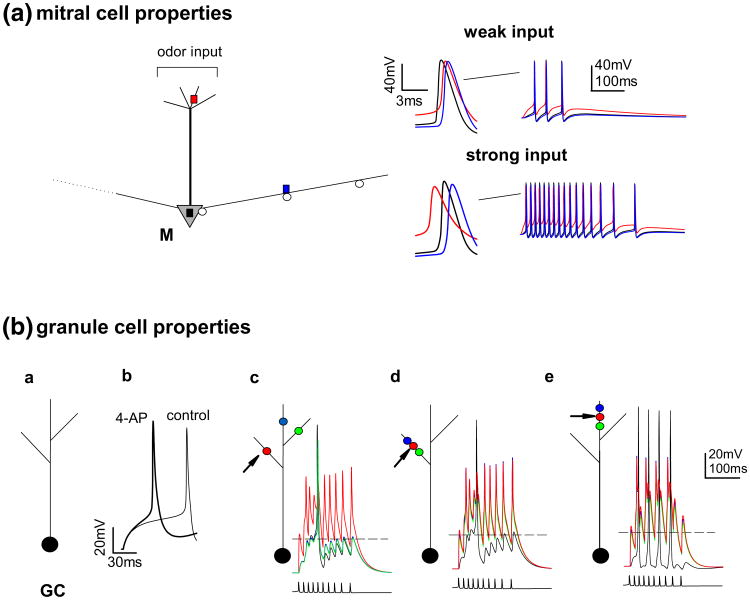
Fig. 1.
Basic properties of the two kind of cells that we used in our model. (a) (left) Schematic representation of the mitral cell morphology; colored squares indicate recording locations for which membrane potential is shown on the right; open circles indicate locations of the inhibitory synapses from granule cells; (right) membrane potential at different locations (lines color correspond to locations indicated on the left part) during a weak (top) or strong (bottom) odor activation. In both cases, the first action potential is shown on an expanded scale. (b) a Schematic representation of a granule cell morphology used in the simulations; b simulation of the somatic membrane potential during a suprathreshold current step injection under control conditions (light line) and after the pharmacological block of the KA current (thick line); c, d, e membrane potential of the soma (black lines) and spines (colored lines) of a granule cell during a train of mitral cell action potentials (bottom plots) activating the red synapse; different synaptic locations were used in c, d, and e; the dashed lines represent the threshold for GABA release

