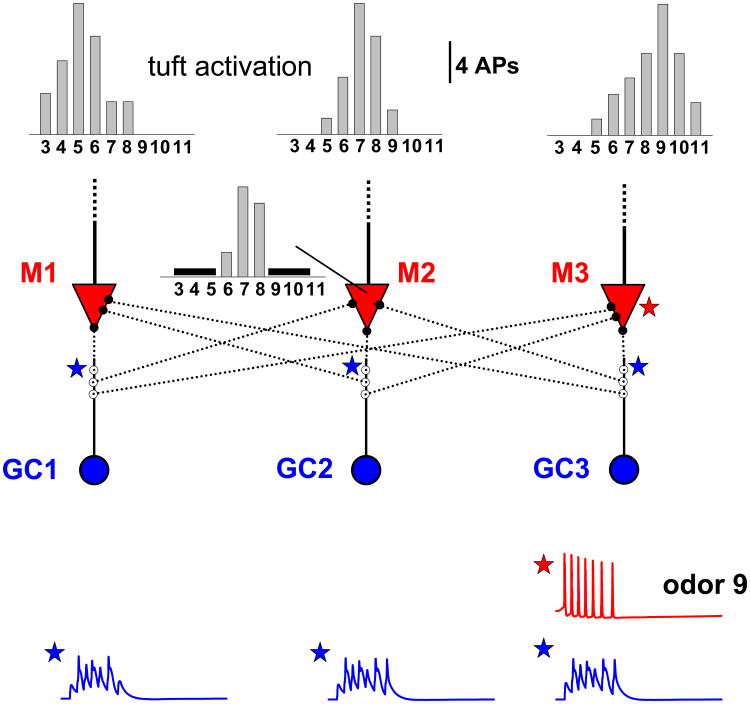
Fig. 6.
Schematic representation of a network using mitral cells without lateral dendrites, to test the effect of different odor inputs as in Fig. 3. M1, M2, and M3 indicate mitral cells, GC1, GC2, and GC3 indicate granule cells. Uniform all-to-all connectivity was arranged through mitral cells soma and granule cell dendrites; Top histograms represents the number of somatic APs elicited in a given mitral cell by each odor input without granule cells in the network. The response of M1 in the presence of the granule cells network is reported in the bottom histogram. Weak input was modeled with a 60% reduction of the strong one. Locations of dendrodendritic synaptic contacts are indicated with small open and closed circles. In all cases, synapses on the granule cells were positioned as in Fig. 1(b d), with a peak inhibitory conductance of 9 nS; traces were obtained from a simulation with a total synaptic input on M3 of 17 nS, as in Fig. 5

