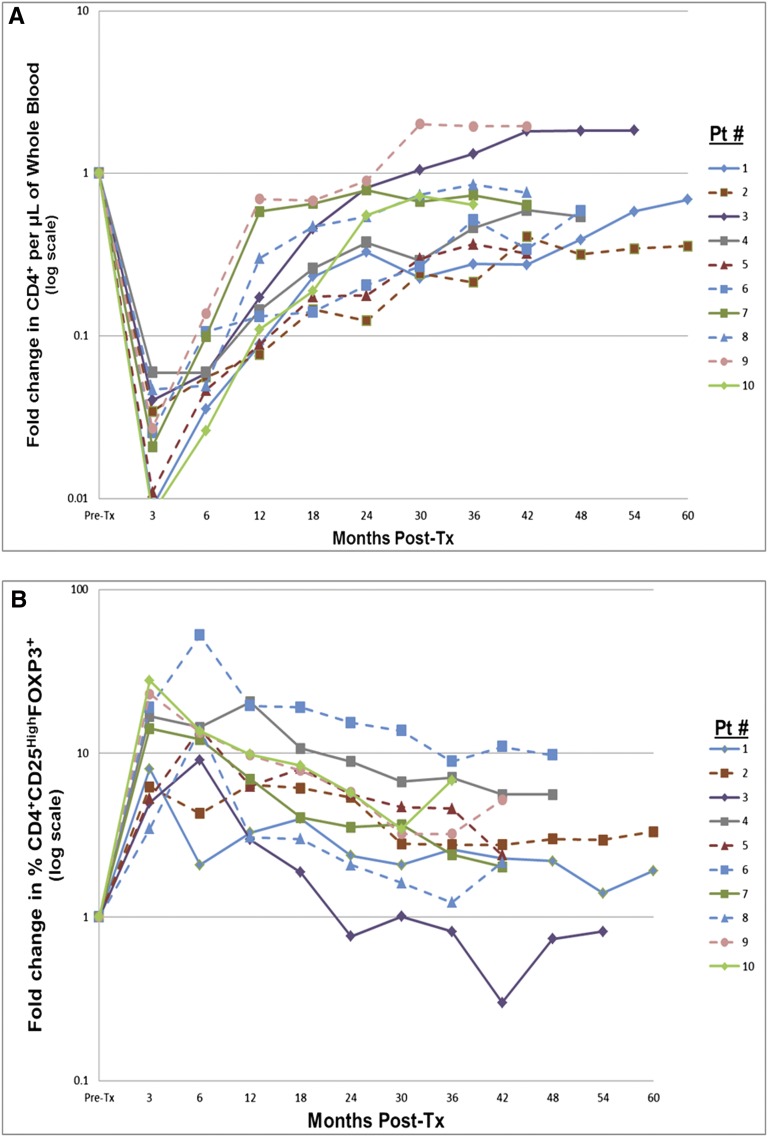
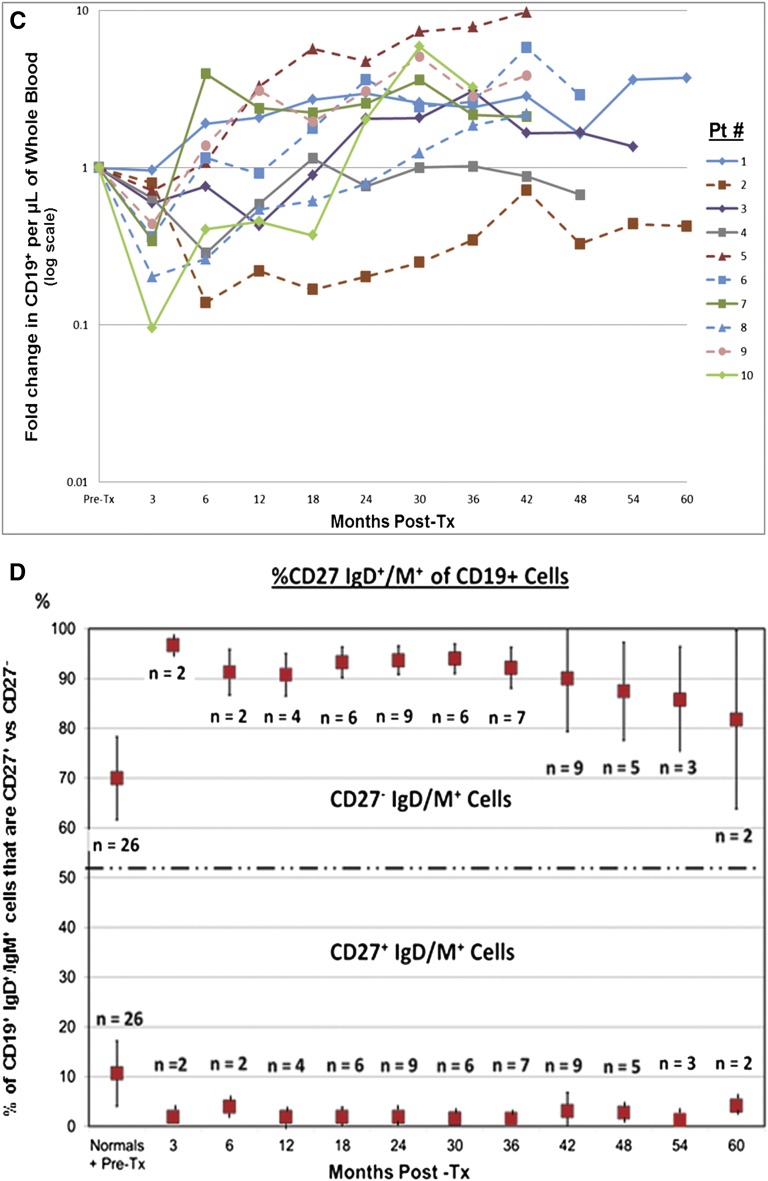
Figure 2.
T and B cell monitoring. (A) Prospective monitoring of recipient CD4+ T cell immunophenotyping for at least 36 months (up to 60 months) postoperatively. Preoperative values have all been normalized to 1. Note that with one exception (outlier) in each group in these first 10 of 20 enrollees, there is a profound and continuing depression in both the nontolerant group (solid lines) and tolerant group (dashed lines), indistinguishable from each other. The vertical axis is logarithmic. The depression actually occurred within 1 week postoperatively, but is recorded here at 3 months and then at 6-monthly intervals. (B) Prospective monitoring of recipient immunophenotypic regulatory T cells (CD4+CD25highCD127−FOXP3+cells) for at least 36 months postoperatively. Preoperative values have all been normalized to 1. Note the prolonged increase in the percentages of this subset lasting up to 60 months postoperatively, indistinguishable between nontolerant (solid lines) and tolerant (dashed lines) groups. Vertical axis is logarithmic. These percentages could only be measured from 3 months onward because of the dearth of CD4+ T cells before that time. (C) Prospective monitoring of recipient CD19+ B cells (pan-B cell epitope) immunophenotyping for at least 36 months (up to 60 months) postoperatively. Preoperative values have all been normalized to 1. Note that the early depression, although similar to the CD4+ subset, is neither as marked nor as prolonged, and that there is an overshoot above preoperative values in both the nontolerant (solid lines) and tolerant (dashed lines) groups that is indistinguishable. Vertical axis is logarithmic in each figure. Although not indicated, these changes appeared earlier as also described in A. (D) The early conversion from preoperative values, reflecting the expected mixture of naïve and activated/memory B cells, to postoperative values favoring naive B cells. Preoperative mean ratios of 7:1 naïve:activated/memory B cells changed to postoperative mean ratios of 20:1. This change persisted from early postoperatively for at least 60 months. Although not indicated in the figure, there is again no difference between the nontolerant and tolerant groups. (This is included as Supplemental Table 1.) This study initiated after the first several enrollees were being followed. It includes patients 19 and 20 so that the earlier preoperative and postoperative time points could be indicated. Preoperative values depicted also include those for 18 normal volunteers and 8 ESRD patients before transplantation, 6 (with their consent) who were not in this trial. There were no differences between these two latter groups. From 12 months onward, the values are only from the first 10 recipients enrolled, as in the remainder of this report. Pt, patient; Post-tx, post-transplantation.


