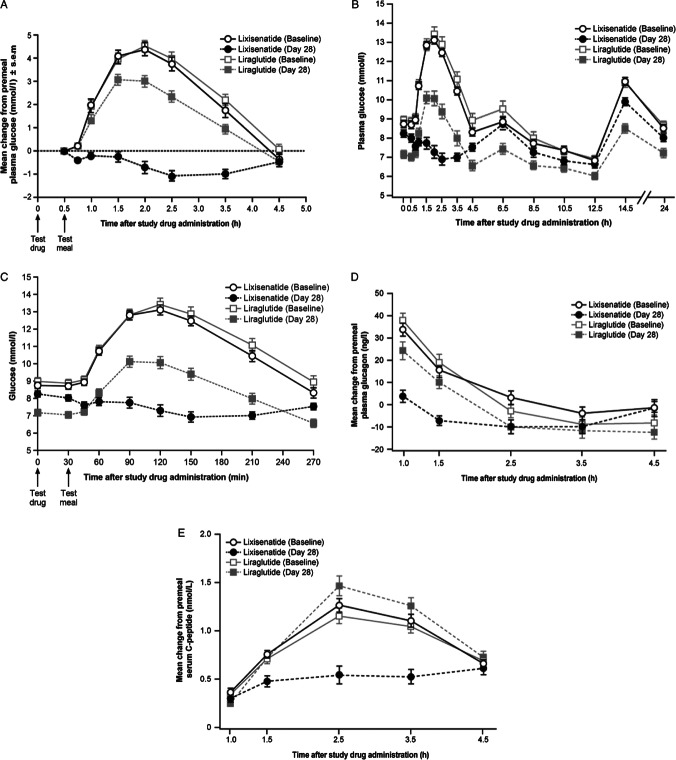
Figure 1.
Postprandial plasma glucose pharmacodynamics. (A) Mean ± s.e.m. postprandial plasma glucose change from premeal values at baseline and day 28; (B) Mean ± s.e.m. of raw data for 24-h postprandial plasma glucose profiles at baseline and day 28; (C) Mean ± s.e.m. of raw data for postprandial plasma glucose profiles at baseline and day 28, for the first 270 min after study drug administration; (D) Mean ± s.e.m. plasma postprandial glucagon change from premeal concentration at baseline and day 28; (E) Mean ± s.e.m. postprandial serum C-peptide change from premeal concentration at baseline and day 28; PPG, postprandial plasma glucose; s.e.m., standard error of the mean.

