
Table 3.
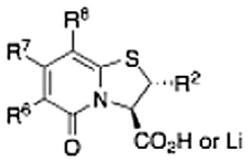
The chemical structures and biological evaluation of tri-substituted derivatives included in the designed set to explore the C-2 and C-6 positions
| |||||
|---|---|---|---|---|---|
| ID | R8 (C-8) | R7 (C-7) | R6 (C-6) | R2 (C-2) | EC50 (μM)a |
| 46 |

|

|
–H |

|
1.0 |
| 47 |
|

|
–H |

|
1.2 |
| 48 |

|
|
–H |

|
0.4 |
| 49 |

|
|
–H |
|
2.5 |
| 50 |

|

|
–H |
|
30 |
| 51 |

|
|
–H |
|
92 |
| 52 |
|
|
|
–H | 18 |
| 53 |
|
|
|
–H | 32 |
| 54 |

|

|
|
–H | 88 |
| 55 |
|

|
|
–H | 16 |
| 56 |
|

|
|
–H | 30 |
| 57 |

|

|
|
–H | 250 |
| 33 |

|

|
–H | –H | 10 |
| 22 |

|
|
–H | –H | 21 |
| 18 |

|

|
–H | –H | 39 |
| – | – | – | – | – | – |
a
Estimated from 16 to 72 data points per concentration.