
Figure 7. Flow cytometry analysis of CD8 and CD44 in liver and spleen.
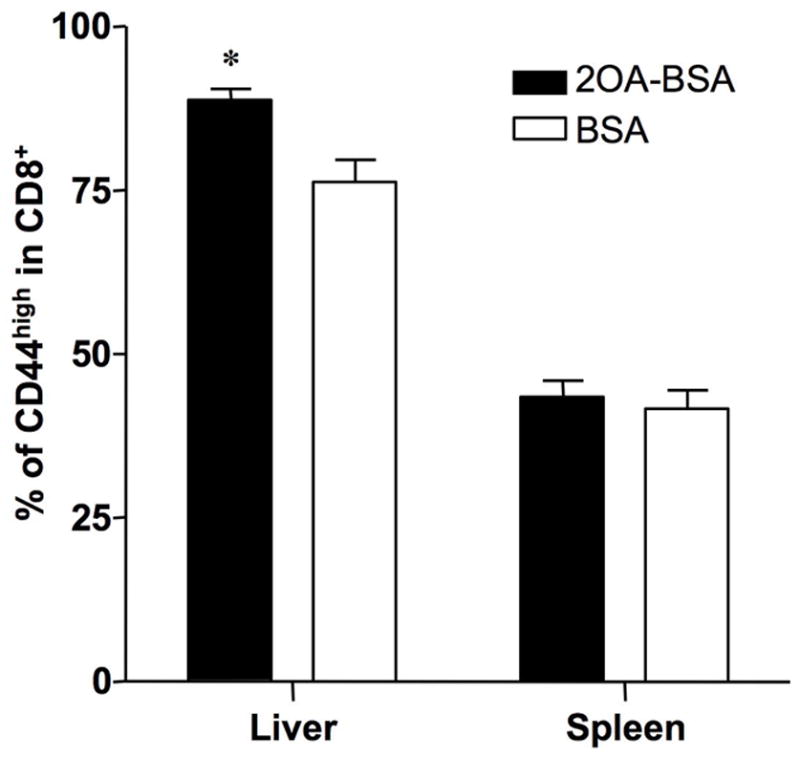
Analysis was performed with gating of TCRβ+ and CD8+ cells. Frequency of CD44high memory T cells in CD8+ T cells were increased in 2OA-BSA-immunized mice liver but not in the spleen compared with BSA-immunized mice. *P<0.05