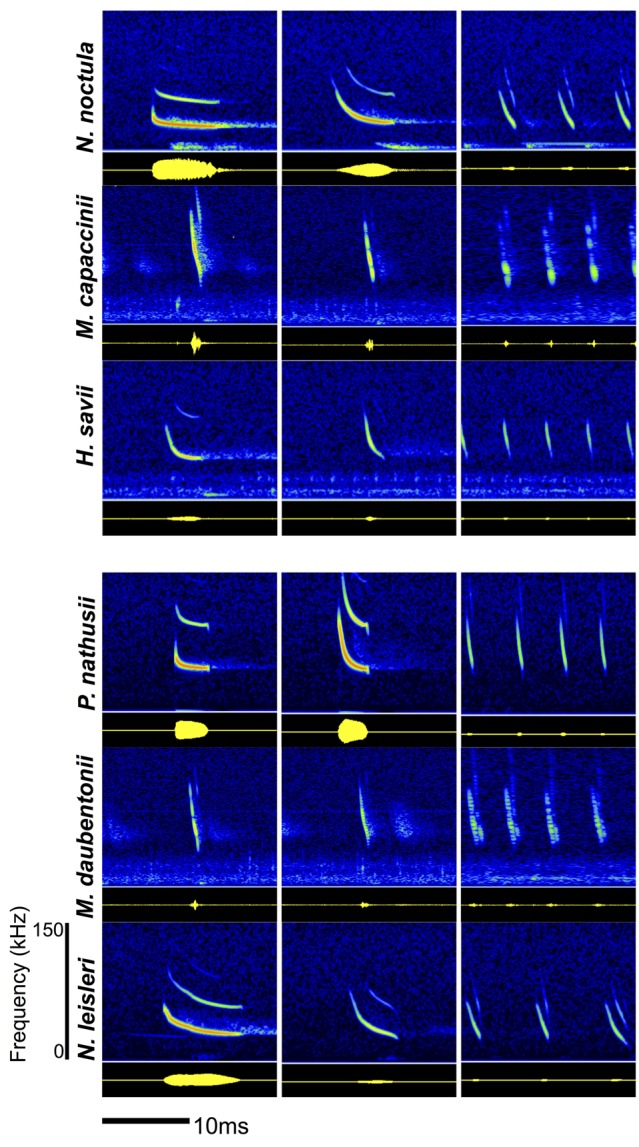
Figure 1.

Spectograms (top panel, amplitude color coded) and oscillograms (below, yellow on black) of the echolocation calls of all six recorded bat species. The echolocation calls show species-specific differences and a characteristic change over the course of a feeding event (search phase, approach phase, feeding buzz).
