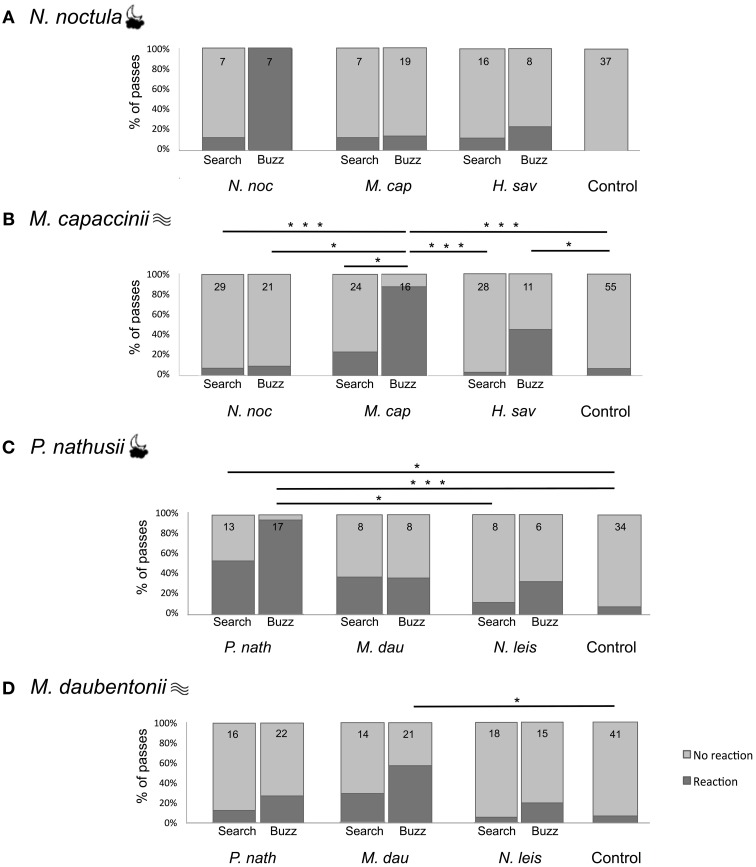
Figure 2.
Percentage of bat passes showing a reaction (dark gray) and no reaction (light gray) in response to the playback of echolocation calls of different species. (A) Reactions of N. noctula and (B)
M. capaccinii in Bulgaria. (C) Reactions of M. daubentonii and (D)
P. nathusii in Germany. The focal species is indicated at the top left of each panel, with symbols indicating its foraging style [cloud ( ) = open-space forager; waves (
 ) = trawling forager]. The playback species is indicated below the bar plots. The small numbers in each bar are the number of recorded passes. Lines and asterisks indicate significant differences between playback types (*0.05 > p ≥ 0.01; **0.01 > p ≥ 0.001; ***p < 0.001) based on multiple comparisons with Tukey contrasts between all seven different playback types.

