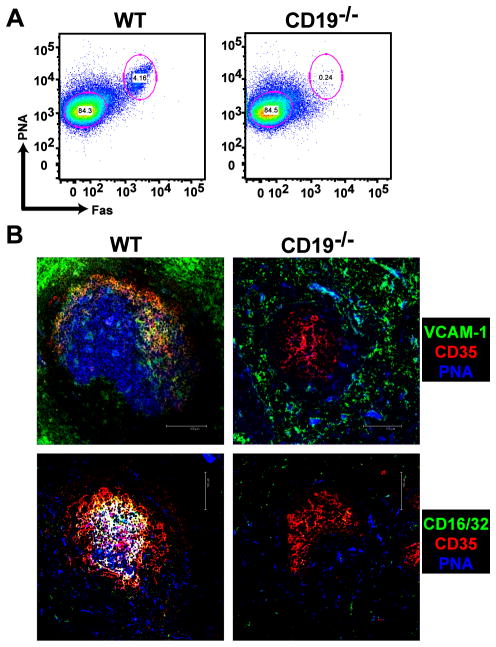
Figure 1. FDC activation and GC formation do not take place in CD19-deficient mice.
(A) C57BL/6 WT and CD19−/− mice were immunized i.p. with SRBC and B220+, PNA+, Fas+ GC B cells were analyzed by flow cytometery 10 days later. (B) GC formation and FDC activation were visualized in the spleen by staining tissue sections with biotinylated PNA (blue), anti-CD35 mAb (red), and anti-VCAM-1 or anti-CD16/32 mAb (green). Overlay of VCAM-1 or CD16/32 with CD35 staining is visualized by yellow, whereas overlay of these markers in addition to PNA staining appears white. Scale bars are 100 μm. Images are representative of 5 independent experiments in which 3 WT and 3 CD19−/− mice were immunized per experiment.

