
Figure 4. FDC development is not altered in CD19−/− mice.
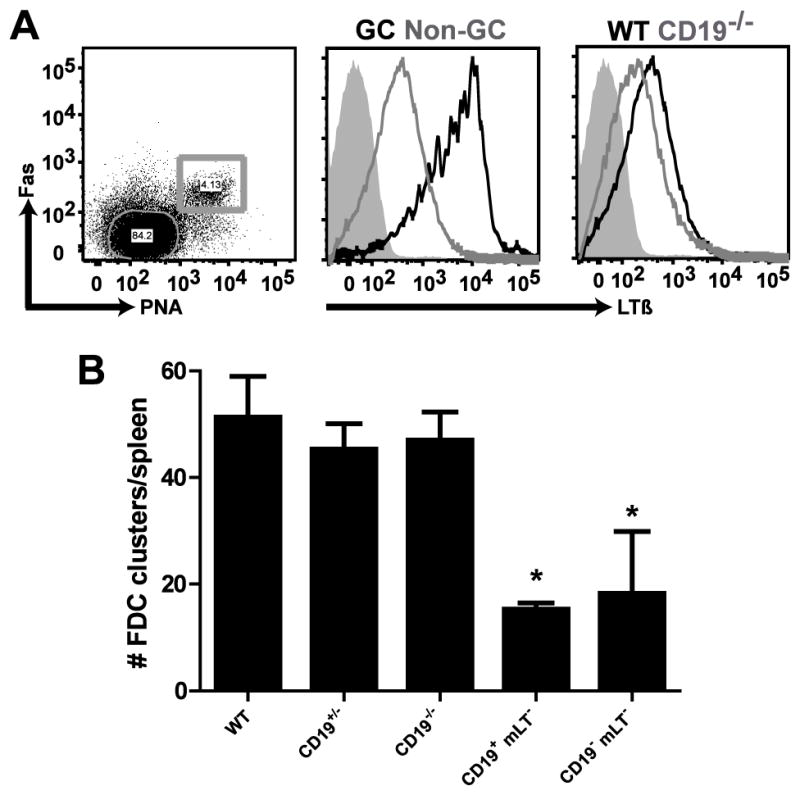
Wild-type and CD19−/− mice were immunized i.p. with SRBC. After 10 days, mLT expression on splenic B cells was analyzed by flow cytometery. (A, middle panel) Analysis of mLT expression on GC B cells in WT mice; B220+, PNA+, Fas+ GC B cells (black line), FO B cells (grey line), isotype control (filled histogram). (A, right panel) Analysis of mLT expression on FO B cells from WT versus CD19−/− mice; FO B cells isolated from WT (black line), FO B cells isolated from CD19−/− (grey line), isotype control (filled histogram). (B) FDC containing follicles in naïve, WT, CD19+/−, CD19−/−, CD19+, mLT− (CD19+/cre, LTβloxp/loxp), and CD19−, mLT− (CD19cre/cre, LTβloxp/loxp) mice were counted in frozen spleen sections using anti-CD35 mAb to visualized FDC. The data represent the average number of CD35+ FDC clusters counted in three sections per spleen and this was determined for 3 mice per genotype. The data are representative of 3 independent experiments with 3 mice per genotype per experiment. The student’s t-test was used to compare the number of FDC-containing follicles in WT versus each of the other genotypes depicted. The data represent the mean ± standard error of the mean. *p<0.01