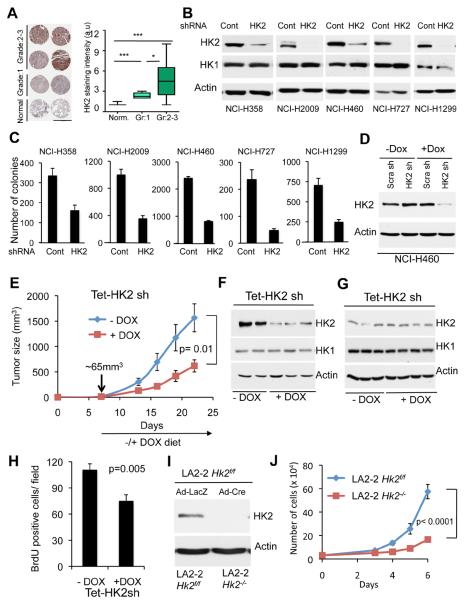
Figure 4. HK2 silencing reverses tumorigenesis of NSCLC cells in vitro and in-vivo.
A. Left panel: Immunohistochemical staining of HK2 expression in representative human NSCLC patient samples tissue microarray (TMA) correlates with the pathological grade of the disease (scale bar 1mm). Right panel: Quantification of HK2 staining intensity in accordance with the pathological grade. TMA samples analyzed are; 20 non-tumor, 22 grade-1, 44 grade-2, and 14 grade-3. Box plots represent the 25th to 75th percentiles (boxes) with median and the whiskers represent the maximum and the minimum value. B. Immunoblot showing the level of HK2 and HK1 protein expression in a panel of human NSCLC cells stably expressing either shRNA targeting HK2 or LacZ shRNA as control. C. Equal numbers of either control or HK2 knockdown cells were subjected to soft-agar assay, and colonies were counted after three weeks. Data are expressed as the mean of three independent experiments ± SEM (p ≤ 0.002). D. Immunoblot showing HK2 protein level in NCI-H460 cells expressing an inducible control or HK2 shRNA. The cells were exposed to vehicle or 500ng/ml doxycycline (DOX) for 96 hrs prior to analysis. E. NCI-H460 cells (0.75×10⁶) were injected subcutaneously into athymic nude mice. When tumor size reached ~65mm3, mice were fed doxycycline containing diet (n=8) or normal chow diet (n=7), and tumor growth was followed until tumor size reached 1.5–2cm3. F. At the end of the experiment described in E, tumor lysates were subjected to immunoblotting with anti-HK2 antibodies. G. Immunoblot showing HK2 protein levels in tumor lysates harvested one week after exposure to the DOX diet. H. BrdU incorporation in tumors one week after exposure to DOX diet. I. Deletion of Hk2 in NSCLC cell line derived from KRasLA2-G12D;Hk2f/f mice. J. Cell proliferation after Hk2 deletion in the NSCLC cell line derived from KRasLA2-G12D;Hk2f/f mice. Data presented in panels C, E, H and J are expressed as the mean ± SEM. See also Fig. S2.

