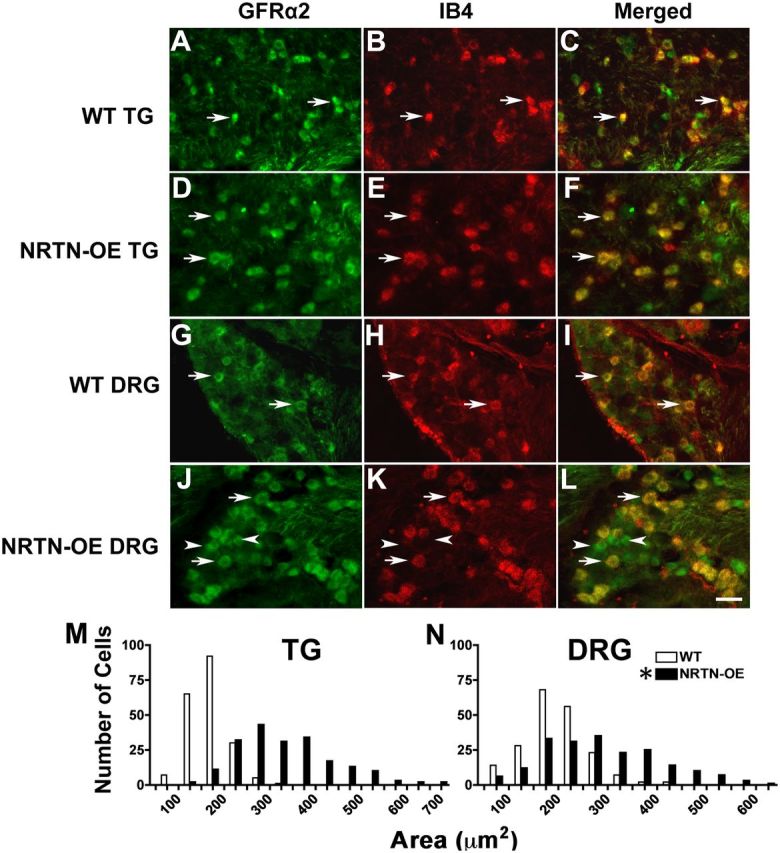
Figure 4.

Somas of NRTN-responsive neurons are hypertrophied. GFRα2-positive/IB4-binding neurons (arrows) from NRTN-OE mice (n = 4) appeared larger relative to WT neurons (n = 4) in the TG (compare A–C with D–F) and DRG (compare G–I with J–L). In WT DRG, GFRα2-positive/IB4-negative neurons were rare, whereas in the NRTN-OE mice, numerous GFRα2-positive/IB4-negative neurons could be found (J–L; arrowheads). The size distribution of somal areas of GFRα2-positive neurons for TG and DRG is shown in M and N, respectively. A significant rightward shift in TG and DRG populations in NRTN-OE ganglia occurs, indicating hypertrophy of GFRα2-positive/IB4-binding neurons. *NRTN-OE > WT (χ2 test, p < 0.05).
