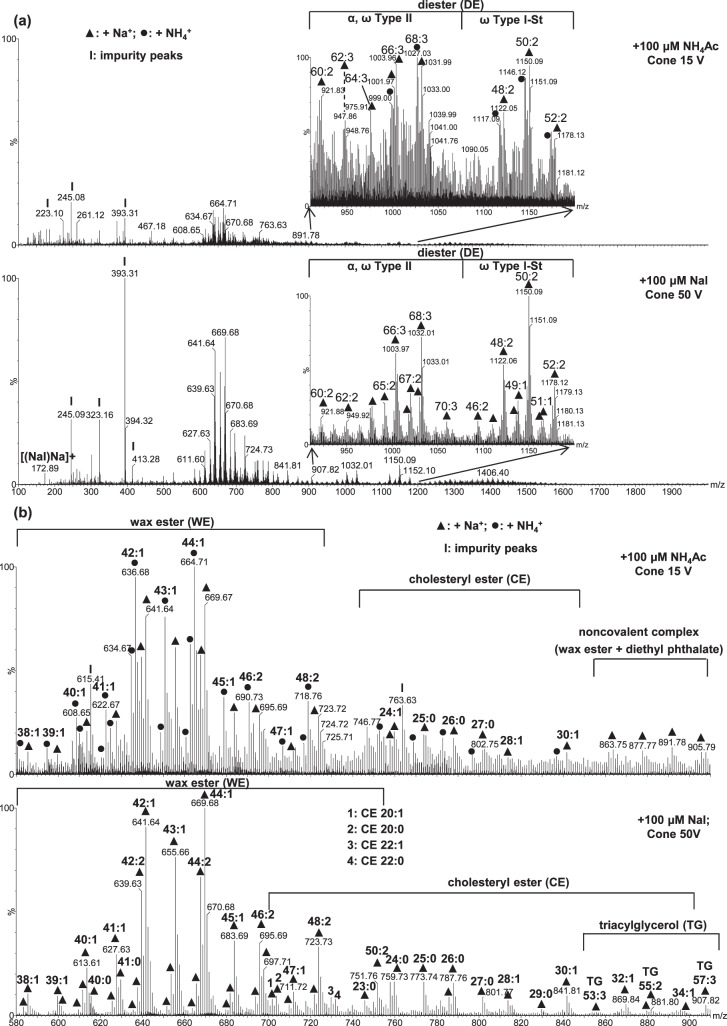
Figure 4.
Electrospray ionization mass spectra of a meibum sample (containing ∼17 μM total lipids) acquired using 100 μM NH4Ac as the additive at cone voltage 15 V, and 100 μM NaI as the additive at cone voltage 50 V: (a) The full range m/z 100 to 2000 of the spectra (almost all the peaks below m/z 495 are impurity peaks) with the insets showing the range m/z 910 to 1200 of the spectra. (b) The range m/z 600 to 910 of the spectra, which mainly contains WEs and CEs. For easier visual comparison of the intensity changes when using the two additives, the intensities of the peaks of two panels in (a) were normalized to the same most intense peak. The experimental conditions utilized were the same as in Figure 3.

