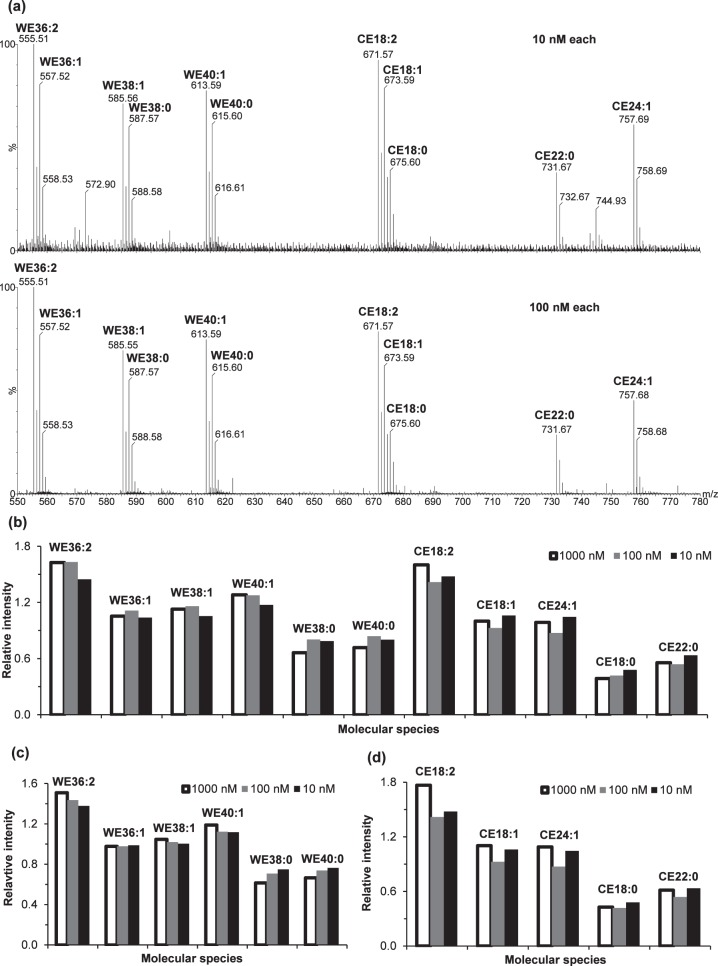
Figure 5.
Electrospray ionization mass spectrometry analysis of 11 WE and CE standards at 10, 100, and 1000 nM equimolar concentrations. (a) The mass spectra for 10 and 100 nM equimolar solution (the spectrum for 1000 or 1 μM equimolar concentration is the same as Fig. 2c). The column graphs of relative peak intensities versus the average intensity for (b) all 11 lipid standards: (c) six WE standards and (d) five CE standards. To maximize detection sensitivity and minimize impurity peaks, slight changes were made to the experimental conditions (solution composition and desolvation temperature) for these different solutions: 10 nM equimolar standards were prepared in 1:140 (vol/vol) chloroform/methanol containing 10 μM sodium iodide; 100 nM equimolar standards were prepared in 1:14 (vol/vol) chloroform/methanol containing 100 μM sodium iodide; and 1000 nM equimolar standards were prepared in 2:1 (vol/vol) chloroform/methanol containing 50 μM sodium iodide. The 10 nM and 100 nM equimolar solutions were analyzed at a desolvation temperature of 250°C, while the 1000 nM equimolar solution were analyzed at a desolvation temperature of 150°C.

