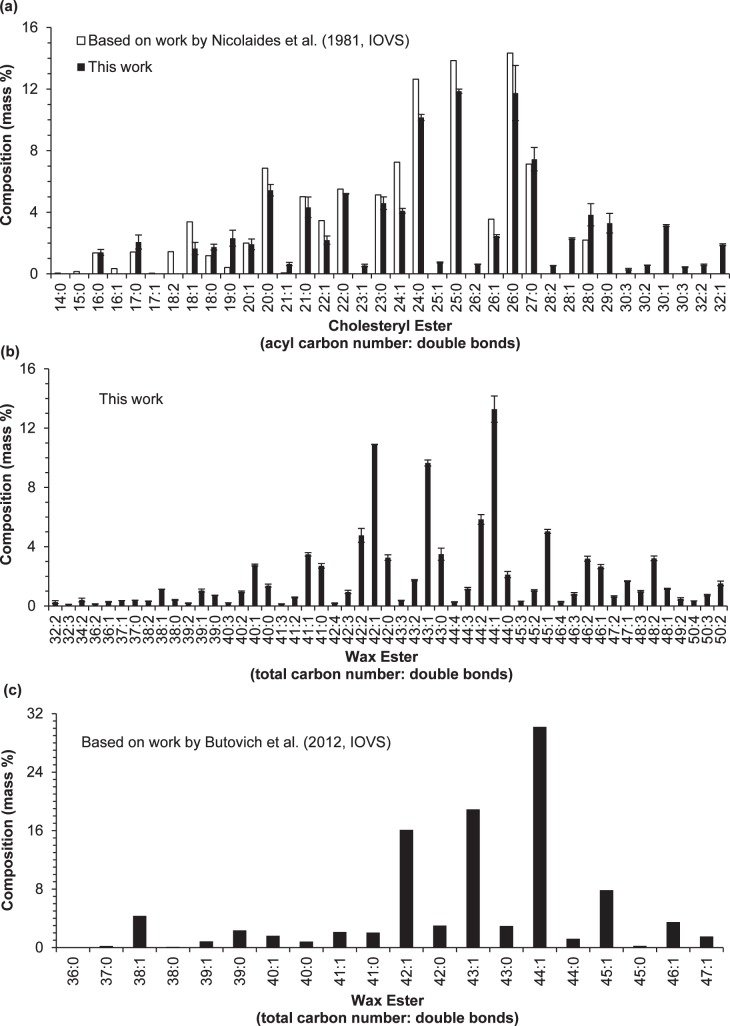
Figure 8.
Comparison of the composition (mass%) of CEs and WEs determined in this work with two previous reports. (a) Side-by-side comparison of the composition of CEs determined in this work with that determined by Nicolaides et al.4; (b) the composition of WEs determined in this work; and (c) the composition of WEs determined by Butovich et al.56 The bar graphs for the two reports4,56 were generated from the data provided in the two references (no standard deviation information was reported). The compositions determined in this work were the average of two samples; the error bars indicate one standard deviation. The experimental conditions used in this experiment were identical to those described in Figure 7.

