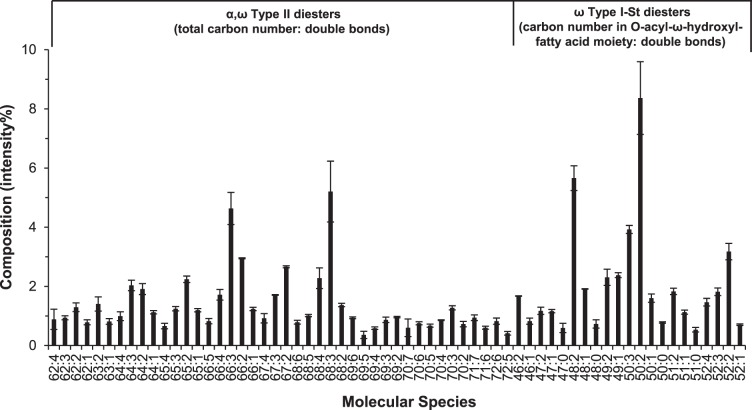
Figure 9.
Distribution profile of DEs in meibum samples. Error bars indicate one standard deviation. The compositions (intensity%) were calculated after correcting for peak overlapping and isotopic distribution. The experimental conditions used in this experiment were identical to those described in Figure 7.

