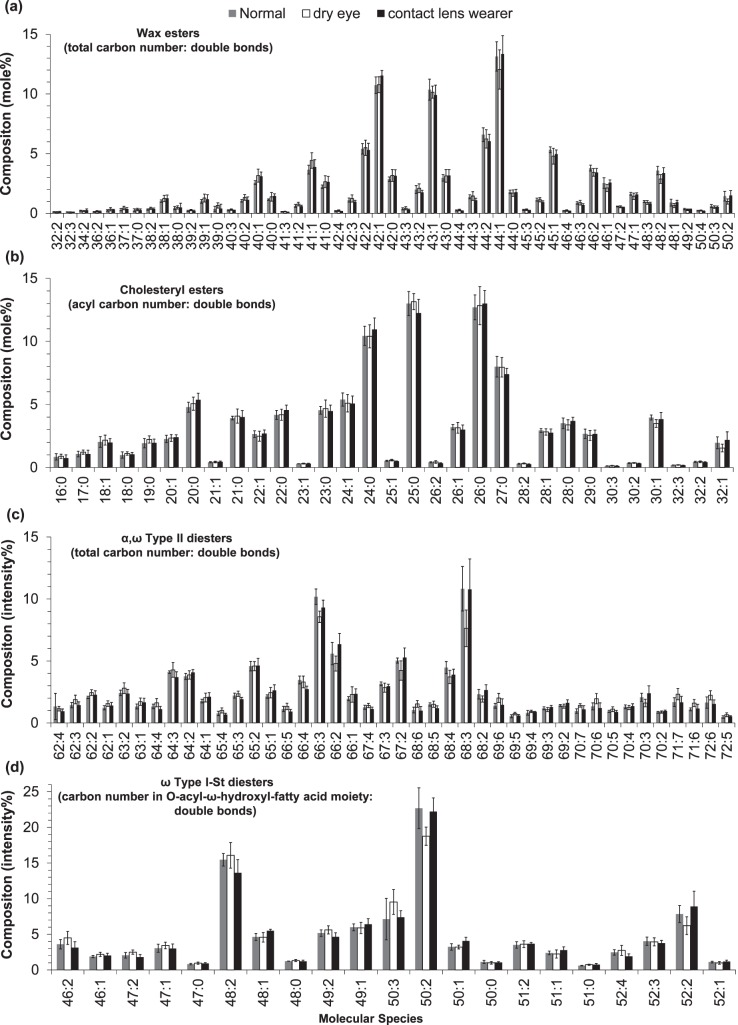
Figure 10.
Distribution profiles of four lipid classes in three groups of meibum samples: (a) WEs, (b) CEs, (c) α,ω Type II DEs, and (d) ω Type I-St DEs. The three groups were normal (four samples); dry eye (five samples); and contact lens wearers who also displayed dry eye symptoms (five samples). Error bars indicate one standard deviation. The compositions (mole%) for (a, b) were calculated after correcting for peak overlapping, isotopic distribution, and relative ionization efficiency; while the compositions (intensity%) for (c, d) were calculated after correcting for peak overlapping and isotopic distribution. See text for experimental details.

