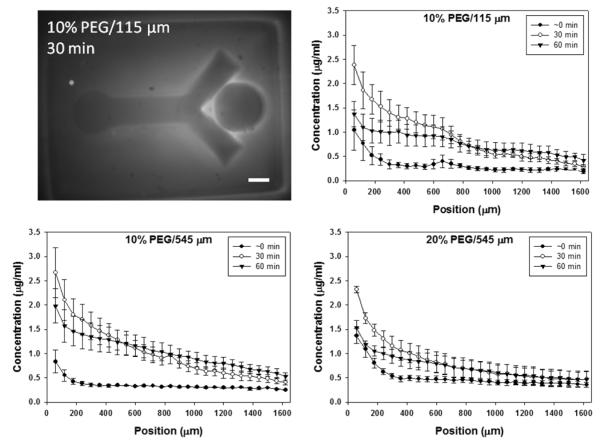
Fig. 7.
Diffusion of soluble fluorescein-BSA through the dual hydrogel system. Relative fluorescence measured at 0, 30, and 60 min for three different schemes was converted to concentration (μg/ml). Graphs show changes in fluorescein-BSA concentration over the length of the agarose-filled bifurcating void, where percentage indicates polyethylene glycol (PEG) concentration and 115 μm and 545 μm indicate distance of protein source well from the bifurcating void. Fluorescent image is representative of the 10% PEG/115 μm scheme. Error bars represent standard deviation (scale bar = 500 μm)

