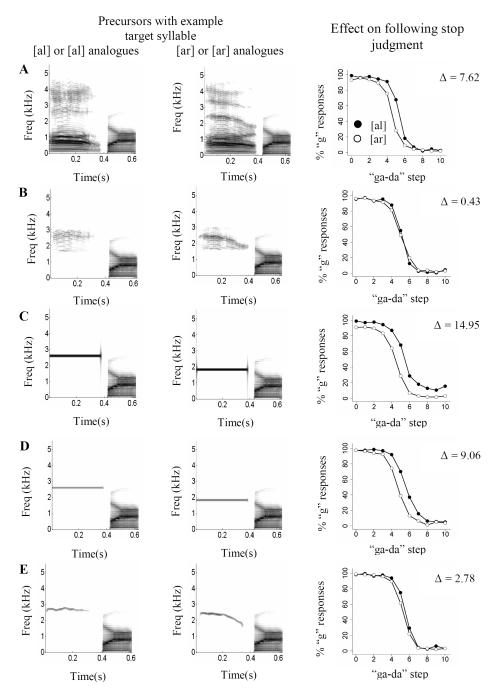
Figure 1.
Spectrograms of representative precursors before sample target syllable in each condition. Precursors and results of Experiment 1 are depicted in panels A & B and of Experiment 2 in panels C~ E. Filled circles indicate responses to [al] or [al] analogues and open circles indicate responses to [ar] or [ar] analogues. Δ indicates the average percentage shift in categorization caused by the precursors averaged over participants and step.

