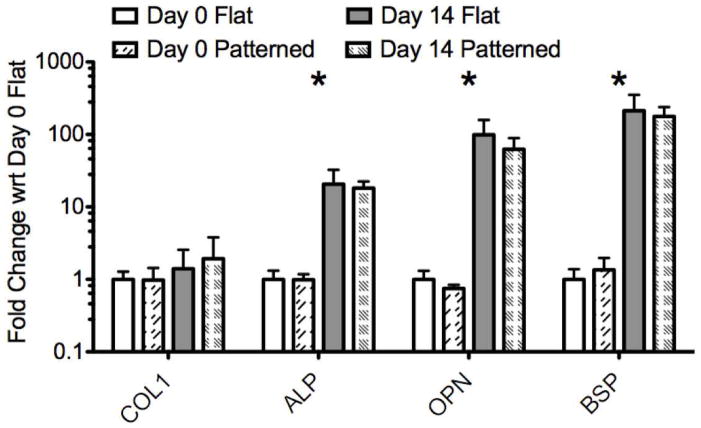
Figure 5.
PCR results. Gene expression is normalized to GAPDH and shown relative to day 0 FF samples on a log scale. Error bars show maximum and minimum values based on the standard deviation of the [delta] [delta] Ct values. Stars indicate a significant difference between day 0 and day 14 (both PF and FF) [delta] Ct values for the gene of interest based on a two-tailed unpaired t-test (p < 0.05).

