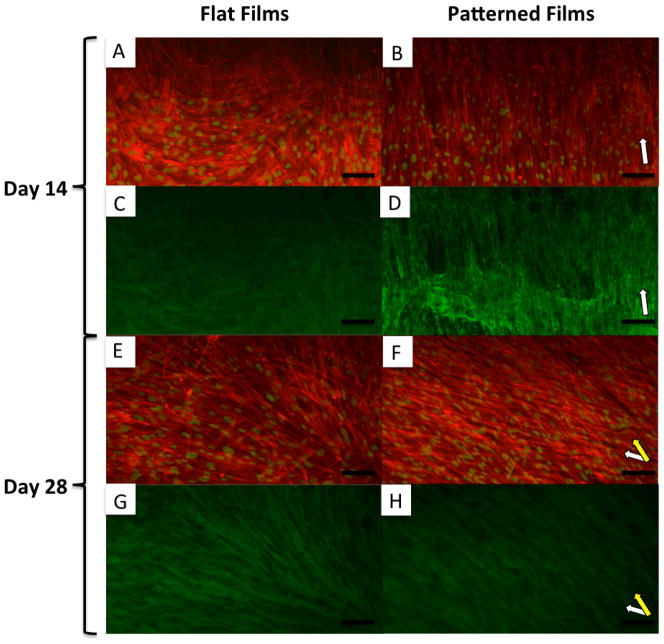
Figure 7.
10x fluorescent microscopy images of MSCs differentiated on FF (A, C, E and G) and PF (B, D, F and H) at 14 (A, B, C and D) and 28 (D, E, F and G) days. A, B, E, and F show actin (red) and nuclei (false colored green) staining. C, D, G, and H show staining for collagen type I (green). White arrows indicate groove direction on PF. Yellow arrow indicates secondary alignment of cells in layer distal to substrate. Scale bar = 100 μm.

