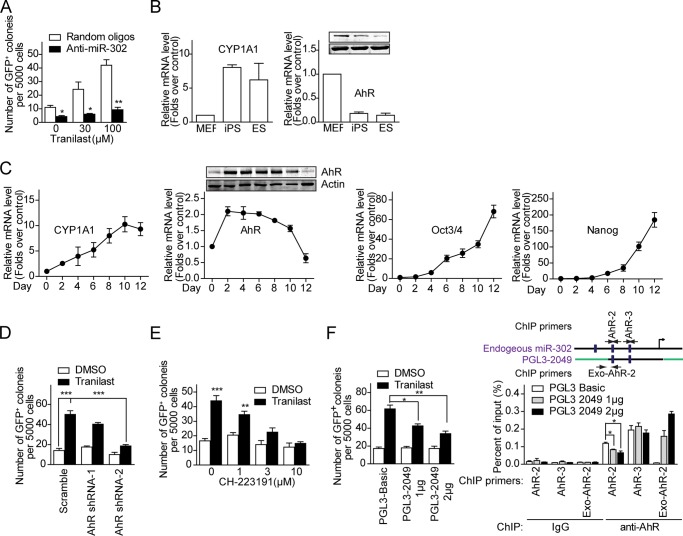
FIGURE 8.
Impairment of AhR-mediated miR-302 expression inhibits tranilast-promoted cell reprogramming. A, blockage of tranilast-promoted cell reprogramming by miR-302 antagomirs. Antagomirs were transfected into OSK-infected MEF cells at day 2 and day 6. Tranilast was added to the culture medium on days 3–9. B, AhR is activated in ES cells and iPS cells. Quantitative RT-PCR and Western blot analysis of the AhR downstream gene CYP1A1 and AhR expression in MEFs, iPS cells, and mES cells. C, quantitative RT-PCR and Western blot analysis of CYP1A1, AhR, Oct4, and Nanog expression on the indicated days in OSK-transduced MEF cells. D, knockdown of AhR reduces tranilast-promoted iPSC generation. MEF cells were infected with OSK together with scrambled control shRNA or AhR-specific shRNA. Tranilast was added to the culture medium on days 3–9. E, blockage of tranilast-induced cell reprogramming by AhR antagonist. Tranilast and AhR antagonist CH-223191 at the indicated concentrations were added to the culture medium of OSK-infected MEFs on days 3–9. F, interruption of AhR binding to the promoter of miR-302 blocks tranilast-induced cell reprogramming. MEF cells were infected with OSK together with pGL3-Basic and pGL3-2049. Tranilast was added to the culture medium on days 3–9. Left, the number of GFP+ colonies generated from tranilast-treated, OSK-infected MEFs is shown. Right, occupation of AhR on miR-302 promoters presented on either pGL3-2049 or miR-302 gene. MEF cells at day 3 were subjected to ChIP assay using anti-AhR and anti-IgG antibodies. Immunoprecipitated DNA was analyzed by quantitative PCR, and the relative enrichments are presented as a percentage of the input DNA. A schematic illustration of primer pairs used for quantitative PCR is shown. Data from three independent experiments are shown as means ± S.E. *, p < 0.05; **, p < 0.01; ***, p < 0.001; versus control.

