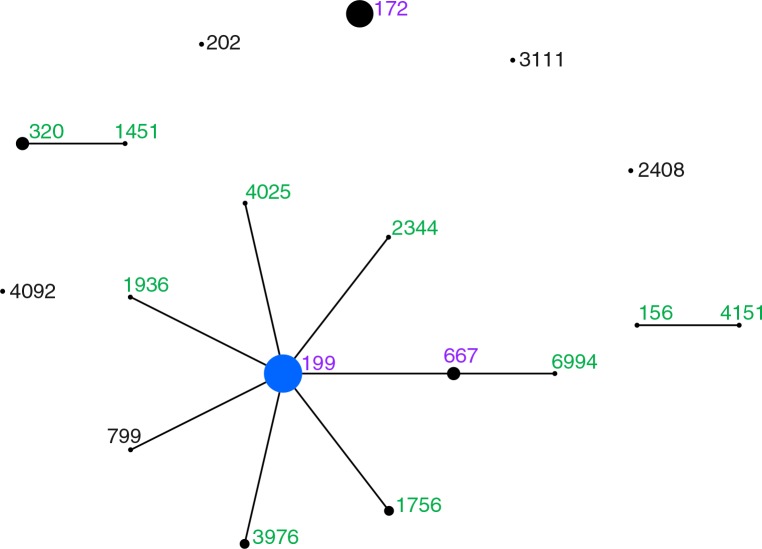
Fig. 1.
Population snapshot of serotype 19A isolates in Alaska comparing sequence types (ST) found in 1986–2000 and 2001–2010. Each circle represents a single ST, with the area proportional to the number of isolates of that type. Solid lines between STs represent single-locus variants. STs in black are STs found only in the pre-PCV7 (1986–2000) era. STs in green are STs found only in the post-PCV7 (2001–2010) era. STs in pink are STs found in both the pre-PCV7 and post-PCV7 eras.

