Figure 2.
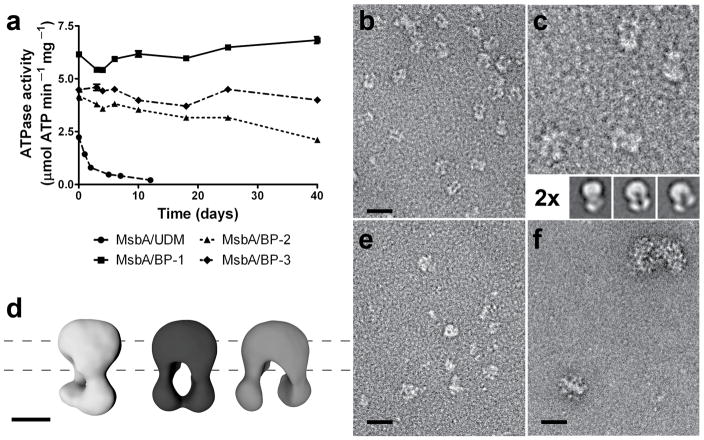
MsbA stability and negative staining EM images. (a) MsbA solubilized in BPs retained high ATPase activity (measured in triplicate at 37 °C) throughout prolonged incubation at RT, demonstrating the protein’s stability. Data represent means ± standard error. (b–f) EM images of MsbA particles. (b) MsbA was mixed with BP-1 with concurrent removal of UDM by dialysis, then diluted 100-fold in detergent-free buffer. Individual particles were readily discernible against a clean background and structural details of the particles were evident. (c) Twofold magnification of (b), with representative 2D class averages (bottom). (d) 3D reconstructions of averages in (c). Dashed lines represent approximate position of the lipid membrane. See Online Methods and Supplementary Fig. 10–11 for more details on the 2D and 3D analyses. (e) MsbA preparation in UDM, diluted 100-fold in the same detergent-containing buffer. While particles were well separated on a relatively clean background, no protein structural details were discernible. (f) Preparation of MsbA in UDM (as in (e)), diluted 20-fold with detergent-free buffer, showing highly aggregated protein. Scale bar represents 35 nm in all images except in (d) where the scale bar represents 5 nm.

