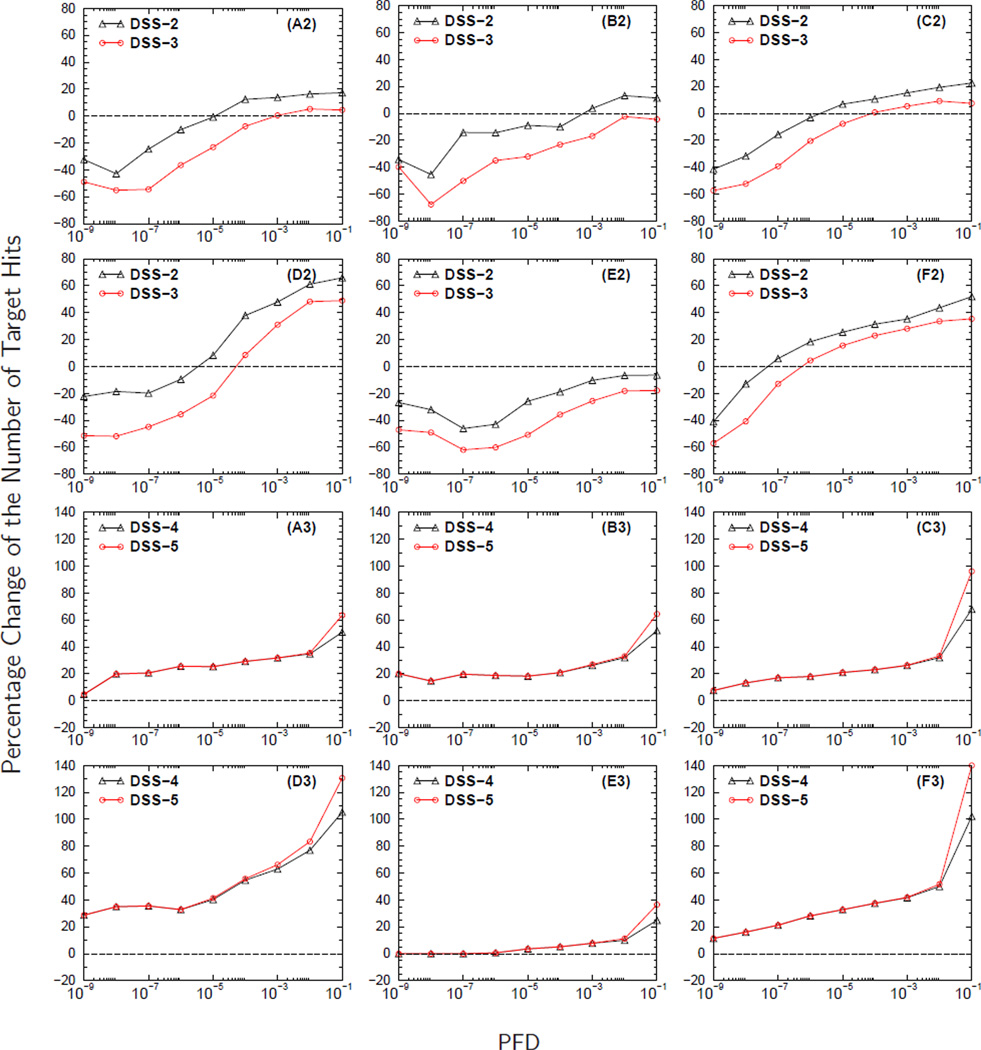
Figure 6. The effect of fractionation scheme on the identification of semi-tryptic and non-tryptic peptides.
Panels headed by A, B, C, D, E, and F correspond to fractionation schemes C3, C8, WCX, SIZE, A/G, and Cys respectively. In panels A2-F2 and A3-F3 are the curves for the percentage change in the number of target hits (PCNTH) versus the proportion of false discoveries (PFD) for the different database search strategies, DSS2-DSS5, computed using equation (3). The curves in panels A2-F2 (A3-F3) were computed from analyzing the MS/MS spectra collected from a complex biological mixture (DG2) with molecular weight error tolerance (MWET) of the parent ion set to ± 3 Da during database searches.

