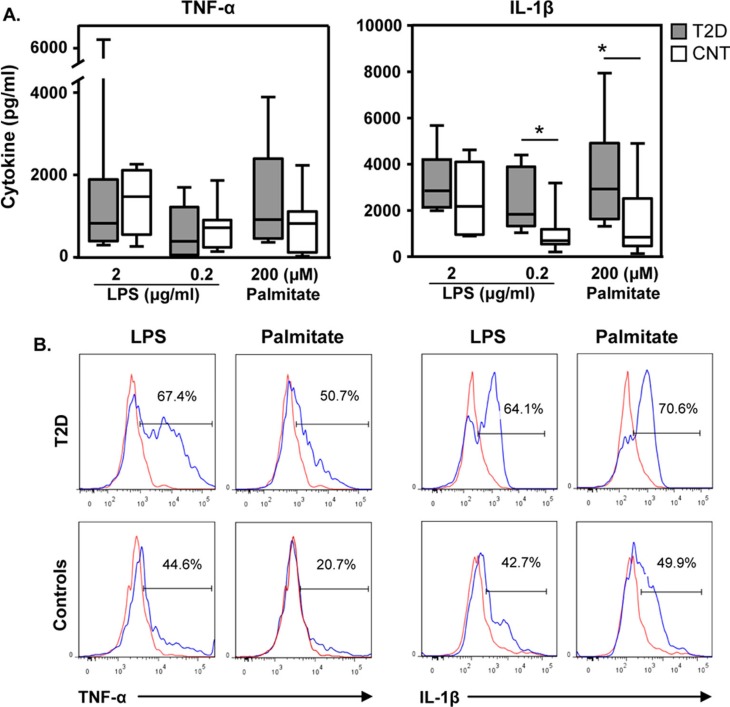
Fig. 2.
T2D cohort demonstrates enhanced cellular sensitivity to TLR4 ligands than obese controls. A. PBMC from youth with (n=8, grey bars) and without (n=8, white bars) T2D were cultured as described in Methods. Whisker plots show medians and ranges (Mann Whitney, *p<0.05). B. PBMC from youth with (n=3) and without T2D (n=3) were activated for 4 hrs with LPS and palmitate. Cells were stained as per Methods (ICCS). Shown are PBMC gated on the CD14 positive cells, the monocyte population. Red lines indicate responses to culture medium alone. Blue lines indicate responses to either LPS or palmitate as indicated. One set of 3 representative results is shown.

