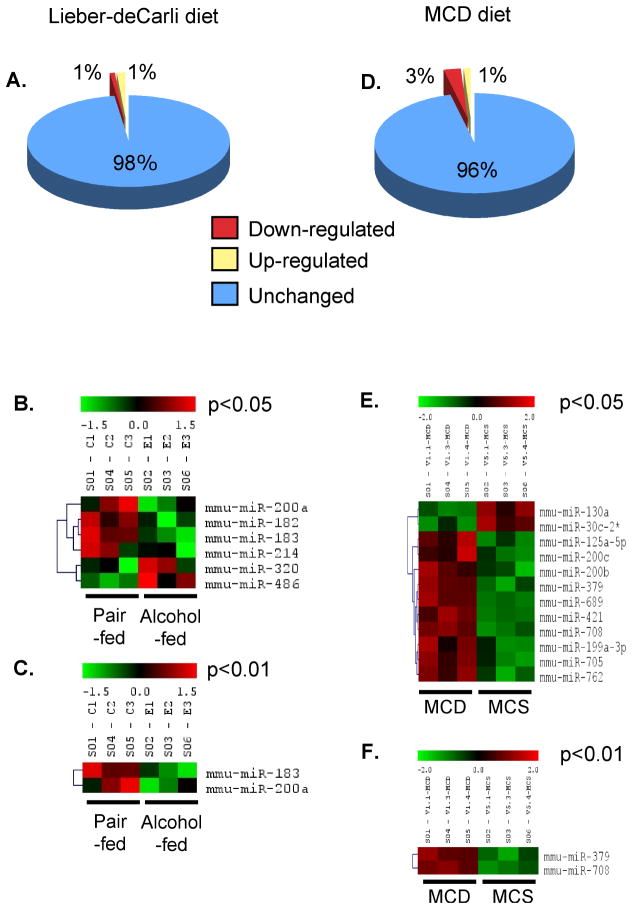
Figure 2.
Steatohepatitis modulates liver microRNA expression.
Liver microRNA expression was analyzed using miRNA Microarray. Panels A and D show the percentage of microRNA that changed during feeding of Lieber-deCarli (A) and MCD (D) diets, compared to corresponding controls. Panels B and E show the heat-maps of microRNAs expression in Lieber-deCarli diet feeding at p<0.05 and p<0.01, respectively. Panels C and F show the expression of microRNAs in MCD diet feeding at p<0.05 and p<0.01, respectively. In panels B,C,E and F (shown n=3), the black color indicates no change, the red color represents up-regulation, and the green color indicates down-regulation of the gene expression; the intensity of the color correlates with the extent of changes.

